Marshallese vs Immigrants from Italy Single Father Poverty
COMPARE
Marshallese
Immigrants from Italy
Single Father Poverty
Single Father Poverty Comparison
Marshallese
Immigrants from Italy
16.9%
SINGLE FATHER POVERTY
3.1/ 100
METRIC RATING
234th/ 347
METRIC RANK
16.4%
SINGLE FATHER POVERTY
35.7/ 100
METRIC RATING
182nd/ 347
METRIC RANK
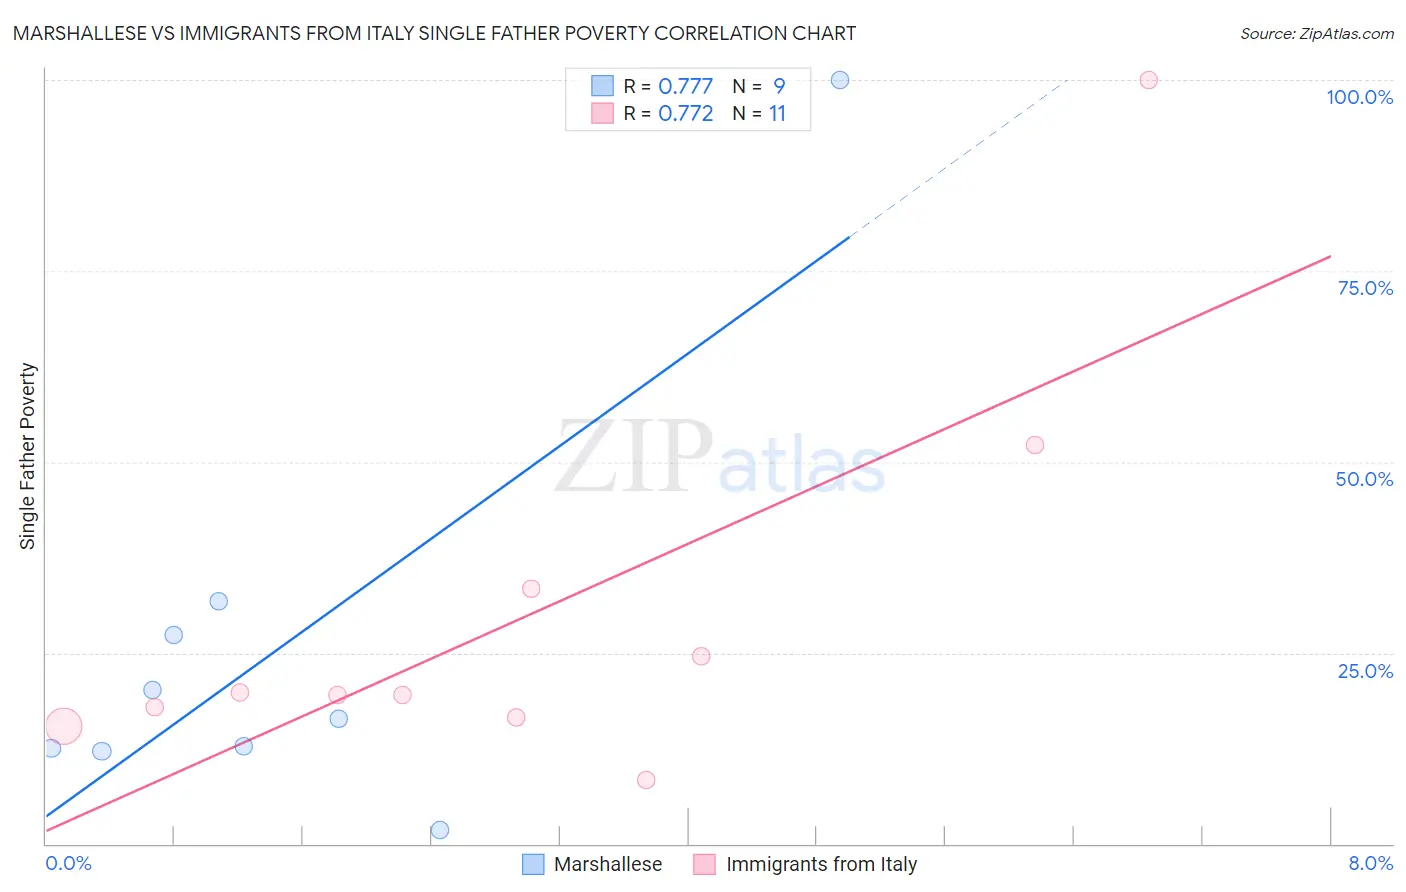
Marshallese vs Immigrants from Italy Single Father Poverty Correlation Chart
The statistical analysis conducted on geographies consisting of 13,927,336 people shows a strong positive correlation between the proportion of Marshallese and poverty level among single fathers in the United States with a correlation coefficient (R) of 0.777 and weighted average of 16.9%. Similarly, the statistical analysis conducted on geographies consisting of 255,121,399 people shows a strong positive correlation between the proportion of Immigrants from Italy and poverty level among single fathers in the United States with a correlation coefficient (R) of 0.772 and weighted average of 16.4%, a difference of 3.1%.
Single Father Poverty Correlation Summary
| Measurement | Marshallese | Immigrants from Italy |
| Minimum | 1.9% | 8.4% |
| Maximum | 100.0% | 100.0% |
| Range | 98.1% | 91.6% |
| Mean | 26.1% | 29.7% |
| Median | 16.3% | 19.5% |
| Interquartile 25% (IQ1) | 12.3% | 16.5% |
| Interquartile 75% (IQ3) | 29.5% | 33.3% |
| Interquartile Range (IQR) | 17.2% | 16.8% |
| Standard Deviation (Sample) | 29.1% | 26.0% |
| Standard Deviation (Population) | 27.4% | 24.8% |
Similar Demographics by Single Father Poverty
Demographics Similar to Marshallese by Single Father Poverty
In terms of single father poverty, the demographic groups most similar to Marshallese are Senegalese (16.9%, a difference of 0.030%), Immigrants from Western Europe (16.9%, a difference of 0.10%), Immigrants from Germany (16.9%, a difference of 0.10%), Subsaharan African (16.9%, a difference of 0.10%), and Immigrants from Grenada (16.9%, a difference of 0.17%).
| Demographics | Rating | Rank | Single Father Poverty |
| British | 5.6 /100 | #227 | Tragic 16.8% |
| Belgians | 5.3 /100 | #228 | Tragic 16.8% |
| Israelis | 4.6 /100 | #229 | Tragic 16.8% |
| Immigrants | Trinidad and Tobago | 4.5 /100 | #230 | Tragic 16.8% |
| Spanish Americans | 3.7 /100 | #231 | Tragic 16.9% |
| Immigrants | Grenada | 3.7 /100 | #232 | Tragic 16.9% |
| Senegalese | 3.2 /100 | #233 | Tragic 16.9% |
| Marshallese | 3.1 /100 | #234 | Tragic 16.9% |
| Immigrants | Western Europe | 2.9 /100 | #235 | Tragic 16.9% |
| Immigrants | Germany | 2.9 /100 | #236 | Tragic 16.9% |
| Sub-Saharan Africans | 2.9 /100 | #237 | Tragic 16.9% |
| Immigrants | Saudi Arabia | 2.7 /100 | #238 | Tragic 16.9% |
| Bermudans | 2.6 /100 | #239 | Tragic 16.9% |
| Finns | 2.6 /100 | #240 | Tragic 16.9% |
| Czechs | 2.3 /100 | #241 | Tragic 17.0% |
Demographics Similar to Immigrants from Italy by Single Father Poverty
In terms of single father poverty, the demographic groups most similar to Immigrants from Italy are Immigrants from Western Africa (16.4%, a difference of 0.010%), Aleut (16.4%, a difference of 0.020%), Cambodian (16.4%, a difference of 0.050%), Immigrants from Latin America (16.4%, a difference of 0.070%), and Panamanian (16.4%, a difference of 0.11%).
| Demographics | Rating | Rank | Single Father Poverty |
| Immigrants | Ecuador | 49.7 /100 | #175 | Average 16.3% |
| Vietnamese | 48.0 /100 | #176 | Average 16.3% |
| Immigrants | South Africa | 44.2 /100 | #177 | Average 16.3% |
| Immigrants | Cuba | 41.6 /100 | #178 | Average 16.4% |
| Serbians | 40.9 /100 | #179 | Average 16.4% |
| Immigrants | Latin America | 37.2 /100 | #180 | Fair 16.4% |
| Immigrants | Western Africa | 36.0 /100 | #181 | Fair 16.4% |
| Immigrants | Italy | 35.7 /100 | #182 | Fair 16.4% |
| Aleuts | 35.3 /100 | #183 | Fair 16.4% |
| Cambodians | 34.6 /100 | #184 | Fair 16.4% |
| Panamanians | 33.6 /100 | #185 | Fair 16.4% |
| Immigrants | Venezuela | 31.0 /100 | #186 | Fair 16.4% |
| Ukrainians | 30.4 /100 | #187 | Fair 16.4% |
| Russians | 30.1 /100 | #188 | Fair 16.4% |
| Latvians | 28.9 /100 | #189 | Fair 16.5% |