Marshallese vs Native Hawaiian Single Father Poverty
COMPARE
Marshallese
Native Hawaiian
Single Father Poverty
Single Father Poverty Comparison
Marshallese
Native Hawaiians
16.9%
SINGLE FATHER POVERTY
3.1/ 100
METRIC RATING
234th/ 347
METRIC RANK
15.7%
SINGLE FATHER POVERTY
95.8/ 100
METRIC RATING
107th/ 347
METRIC RANK
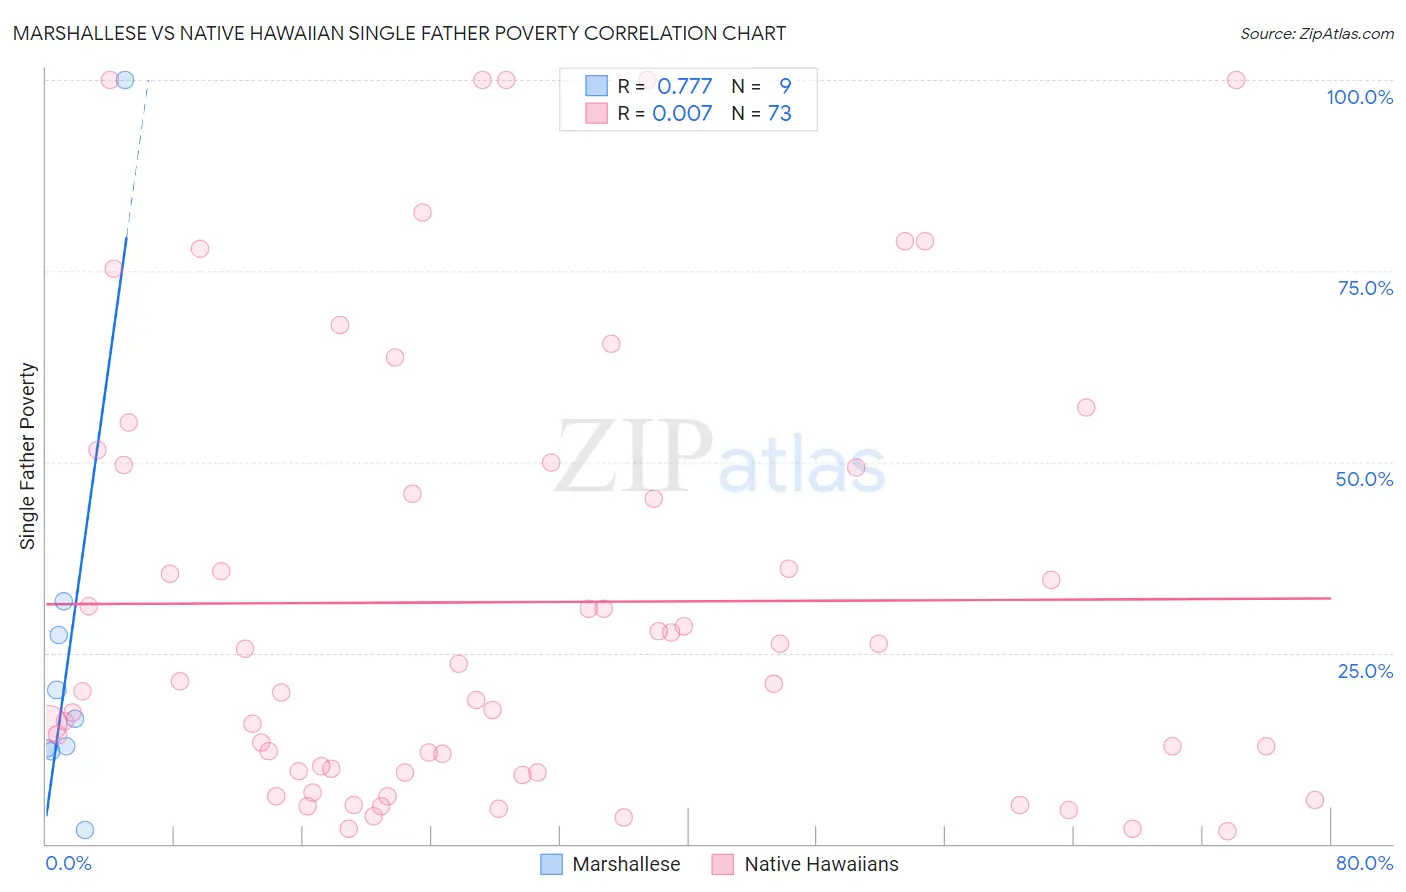
Marshallese vs Native Hawaiian Single Father Poverty Correlation Chart
The statistical analysis conducted on geographies consisting of 13,927,336 people shows a strong positive correlation between the proportion of Marshallese and poverty level among single fathers in the United States with a correlation coefficient (R) of 0.777 and weighted average of 16.9%. Similarly, the statistical analysis conducted on geographies consisting of 273,491,221 people shows no correlation between the proportion of Native Hawaiians and poverty level among single fathers in the United States with a correlation coefficient (R) of 0.007 and weighted average of 15.7%, a difference of 7.5%.
Single Father Poverty Correlation Summary
| Measurement | Marshallese | Native Hawaiian |
| Minimum | 1.9% | 1.7% |
| Maximum | 100.0% | 100.0% |
| Range | 98.1% | 98.3% |
| Mean | 26.1% | 31.6% |
| Median | 16.3% | 20.9% |
| Interquartile 25% (IQ1) | 12.3% | 9.4% |
| Interquartile 75% (IQ3) | 29.5% | 49.4% |
| Interquartile Range (IQR) | 17.2% | 40.0% |
| Standard Deviation (Sample) | 29.1% | 28.8% |
| Standard Deviation (Population) | 27.4% | 28.6% |
Similar Demographics by Single Father Poverty
Demographics Similar to Marshallese by Single Father Poverty
In terms of single father poverty, the demographic groups most similar to Marshallese are Senegalese (16.9%, a difference of 0.030%), Immigrants from Western Europe (16.9%, a difference of 0.10%), Immigrants from Germany (16.9%, a difference of 0.10%), Subsaharan African (16.9%, a difference of 0.10%), and Immigrants from Grenada (16.9%, a difference of 0.17%).
| Demographics | Rating | Rank | Single Father Poverty |
| British | 5.6 /100 | #227 | Tragic 16.8% |
| Belgians | 5.3 /100 | #228 | Tragic 16.8% |
| Israelis | 4.6 /100 | #229 | Tragic 16.8% |
| Immigrants | Trinidad and Tobago | 4.5 /100 | #230 | Tragic 16.8% |
| Spanish Americans | 3.7 /100 | #231 | Tragic 16.9% |
| Immigrants | Grenada | 3.7 /100 | #232 | Tragic 16.9% |
| Senegalese | 3.2 /100 | #233 | Tragic 16.9% |
| Marshallese | 3.1 /100 | #234 | Tragic 16.9% |
| Immigrants | Western Europe | 2.9 /100 | #235 | Tragic 16.9% |
| Immigrants | Germany | 2.9 /100 | #236 | Tragic 16.9% |
| Sub-Saharan Africans | 2.9 /100 | #237 | Tragic 16.9% |
| Immigrants | Saudi Arabia | 2.7 /100 | #238 | Tragic 16.9% |
| Bermudans | 2.6 /100 | #239 | Tragic 16.9% |
| Finns | 2.6 /100 | #240 | Tragic 16.9% |
| Czechs | 2.3 /100 | #241 | Tragic 17.0% |
Demographics Similar to Native Hawaiians by Single Father Poverty
In terms of single father poverty, the demographic groups most similar to Native Hawaiians are Pakistani (15.7%, a difference of 0.010%), Immigrants from Poland (15.7%, a difference of 0.020%), Immigrants from Australia (15.7%, a difference of 0.090%), Australian (15.7%, a difference of 0.10%), and South American Indian (15.7%, a difference of 0.12%).
| Demographics | Rating | Rank | Single Father Poverty |
| Immigrants | Chile | 96.9 /100 | #100 | Exceptional 15.7% |
| Fijians | 96.8 /100 | #101 | Exceptional 15.7% |
| Chileans | 96.4 /100 | #102 | Exceptional 15.7% |
| South American Indians | 96.2 /100 | #103 | Exceptional 15.7% |
| Australians | 96.1 /100 | #104 | Exceptional 15.7% |
| Immigrants | Australia | 96.1 /100 | #105 | Exceptional 15.7% |
| Immigrants | Poland | 95.8 /100 | #106 | Exceptional 15.7% |
| Native Hawaiians | 95.8 /100 | #107 | Exceptional 15.7% |
| Pakistanis | 95.7 /100 | #108 | Exceptional 15.7% |
| Turks | 95.1 /100 | #109 | Exceptional 15.8% |
| Immigrants | Africa | 95.1 /100 | #110 | Exceptional 15.8% |
| Bulgarians | 94.8 /100 | #111 | Exceptional 15.8% |
| Immigrants | Latvia | 94.7 /100 | #112 | Exceptional 15.8% |
| Danes | 94.5 /100 | #113 | Exceptional 15.8% |
| Argentineans | 94.4 /100 | #114 | Exceptional 15.8% |