Marshallese vs Egyptian Single Father Poverty
COMPARE
Marshallese
Egyptian
Single Father Poverty
Single Father Poverty Comparison
Marshallese
Egyptians
16.9%
SINGLE FATHER POVERTY
3.1/ 100
METRIC RATING
234th/ 347
METRIC RANK
14.7%
SINGLE FATHER POVERTY
100.0/ 100
METRIC RATING
34th/ 347
METRIC RANK
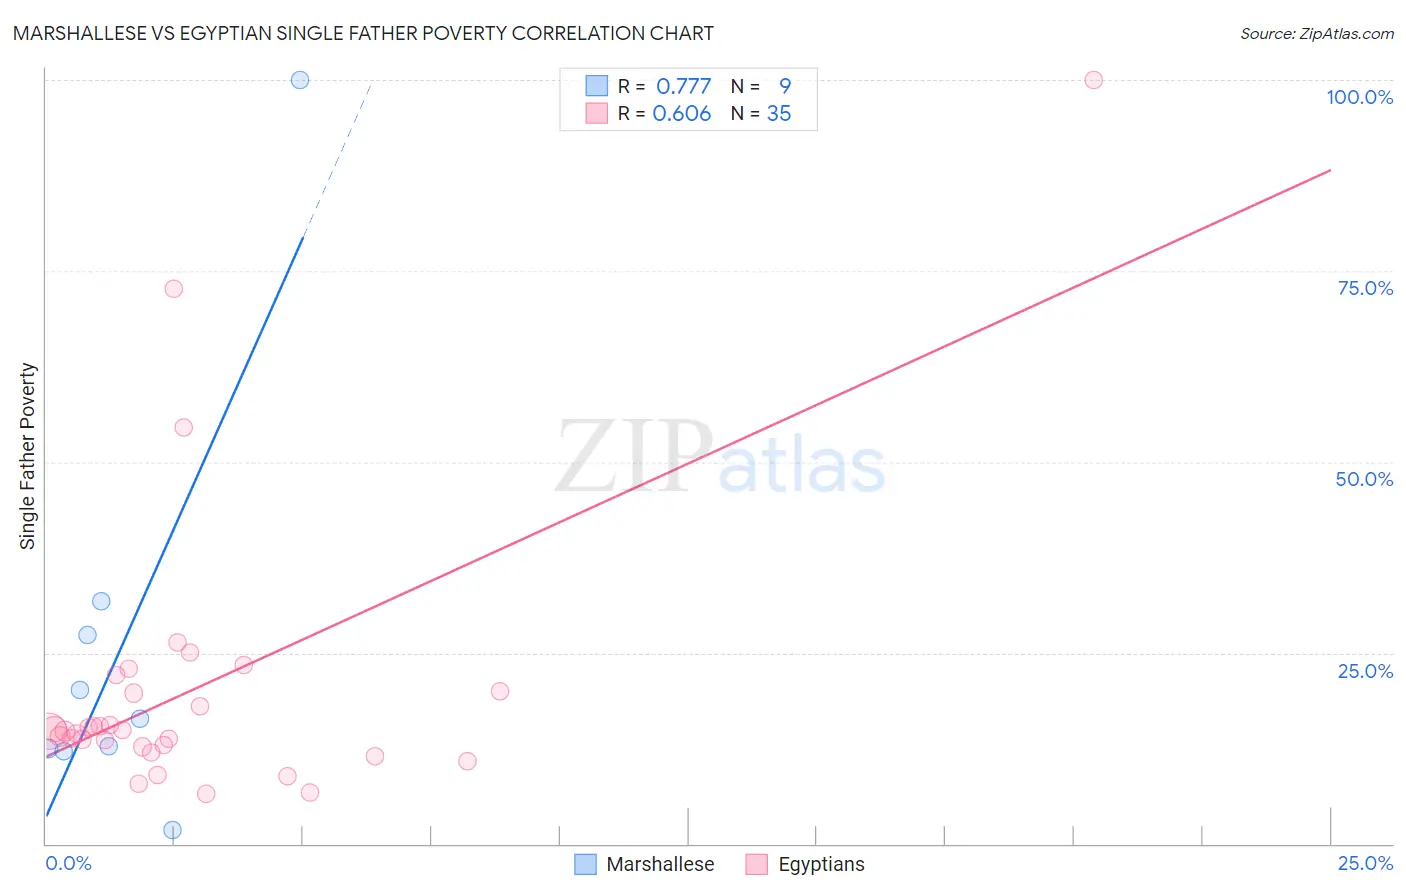
Marshallese vs Egyptian Single Father Poverty Correlation Chart
The statistical analysis conducted on geographies consisting of 13,927,336 people shows a strong positive correlation between the proportion of Marshallese and poverty level among single fathers in the United States with a correlation coefficient (R) of 0.777 and weighted average of 16.9%. Similarly, the statistical analysis conducted on geographies consisting of 226,846,927 people shows a significant positive correlation between the proportion of Egyptians and poverty level among single fathers in the United States with a correlation coefficient (R) of 0.606 and weighted average of 14.7%, a difference of 15.4%.
Single Father Poverty Correlation Summary
| Measurement | Marshallese | Egyptian |
| Minimum | 1.9% | 6.6% |
| Maximum | 100.0% | 100.0% |
| Range | 98.1% | 93.4% |
| Mean | 26.1% | 20.2% |
| Median | 16.3% | 14.8% |
| Interquartile 25% (IQ1) | 12.3% | 12.7% |
| Interquartile 75% (IQ3) | 29.5% | 20.0% |
| Interquartile Range (IQR) | 17.2% | 7.3% |
| Standard Deviation (Sample) | 29.1% | 18.7% |
| Standard Deviation (Population) | 27.4% | 18.5% |
Similar Demographics by Single Father Poverty
Demographics Similar to Marshallese by Single Father Poverty
In terms of single father poverty, the demographic groups most similar to Marshallese are Senegalese (16.9%, a difference of 0.030%), Immigrants from Western Europe (16.9%, a difference of 0.10%), Immigrants from Germany (16.9%, a difference of 0.10%), Subsaharan African (16.9%, a difference of 0.10%), and Immigrants from Grenada (16.9%, a difference of 0.17%).
| Demographics | Rating | Rank | Single Father Poverty |
| British | 5.6 /100 | #227 | Tragic 16.8% |
| Belgians | 5.3 /100 | #228 | Tragic 16.8% |
| Israelis | 4.6 /100 | #229 | Tragic 16.8% |
| Immigrants | Trinidad and Tobago | 4.5 /100 | #230 | Tragic 16.8% |
| Spanish Americans | 3.7 /100 | #231 | Tragic 16.9% |
| Immigrants | Grenada | 3.7 /100 | #232 | Tragic 16.9% |
| Senegalese | 3.2 /100 | #233 | Tragic 16.9% |
| Marshallese | 3.1 /100 | #234 | Tragic 16.9% |
| Immigrants | Western Europe | 2.9 /100 | #235 | Tragic 16.9% |
| Immigrants | Germany | 2.9 /100 | #236 | Tragic 16.9% |
| Sub-Saharan Africans | 2.9 /100 | #237 | Tragic 16.9% |
| Immigrants | Saudi Arabia | 2.7 /100 | #238 | Tragic 16.9% |
| Bermudans | 2.6 /100 | #239 | Tragic 16.9% |
| Finns | 2.6 /100 | #240 | Tragic 16.9% |
| Czechs | 2.3 /100 | #241 | Tragic 17.0% |
Demographics Similar to Egyptians by Single Father Poverty
In terms of single father poverty, the demographic groups most similar to Egyptians are Immigrants from Bolivia (14.7%, a difference of 0.070%), Okinawan (14.6%, a difference of 0.10%), Immigrants from Indonesia (14.7%, a difference of 0.24%), Immigrants from Eastern Africa (14.7%, a difference of 0.36%), and Bolivian (14.7%, a difference of 0.37%).
| Demographics | Rating | Rank | Single Father Poverty |
| Nepalese | 100.0 /100 | #27 | Exceptional 14.4% |
| Immigrants | South Central Asia | 100.0 /100 | #28 | Exceptional 14.5% |
| Somalis | 100.0 /100 | #29 | Exceptional 14.5% |
| Thais | 100.0 /100 | #30 | Exceptional 14.5% |
| Icelanders | 100.0 /100 | #31 | Exceptional 14.5% |
| Asians | 100.0 /100 | #32 | Exceptional 14.6% |
| Okinawans | 100.0 /100 | #33 | Exceptional 14.6% |
| Egyptians | 100.0 /100 | #34 | Exceptional 14.7% |
| Immigrants | Bolivia | 100.0 /100 | #35 | Exceptional 14.7% |
| Immigrants | Indonesia | 100.0 /100 | #36 | Exceptional 14.7% |
| Immigrants | Eastern Africa | 100.0 /100 | #37 | Exceptional 14.7% |
| Bolivians | 100.0 /100 | #38 | Exceptional 14.7% |
| Immigrants | Asia | 100.0 /100 | #39 | Exceptional 14.7% |
| Pima | 100.0 /100 | #40 | Exceptional 14.8% |
| Indians (Asian) | 100.0 /100 | #41 | Exceptional 14.8% |