Marshallese vs Immigrants from Taiwan 9th Grade
COMPARE
Marshallese
Immigrants from Taiwan
9th Grade
9th Grade Comparison
Marshallese
Immigrants from Taiwan
94.7%
9TH GRADE
27.9/ 100
METRIC RATING
195th/ 347
METRIC RANK
95.2%
9TH GRADE
85.3/ 100
METRIC RATING
140th/ 347
METRIC RANK
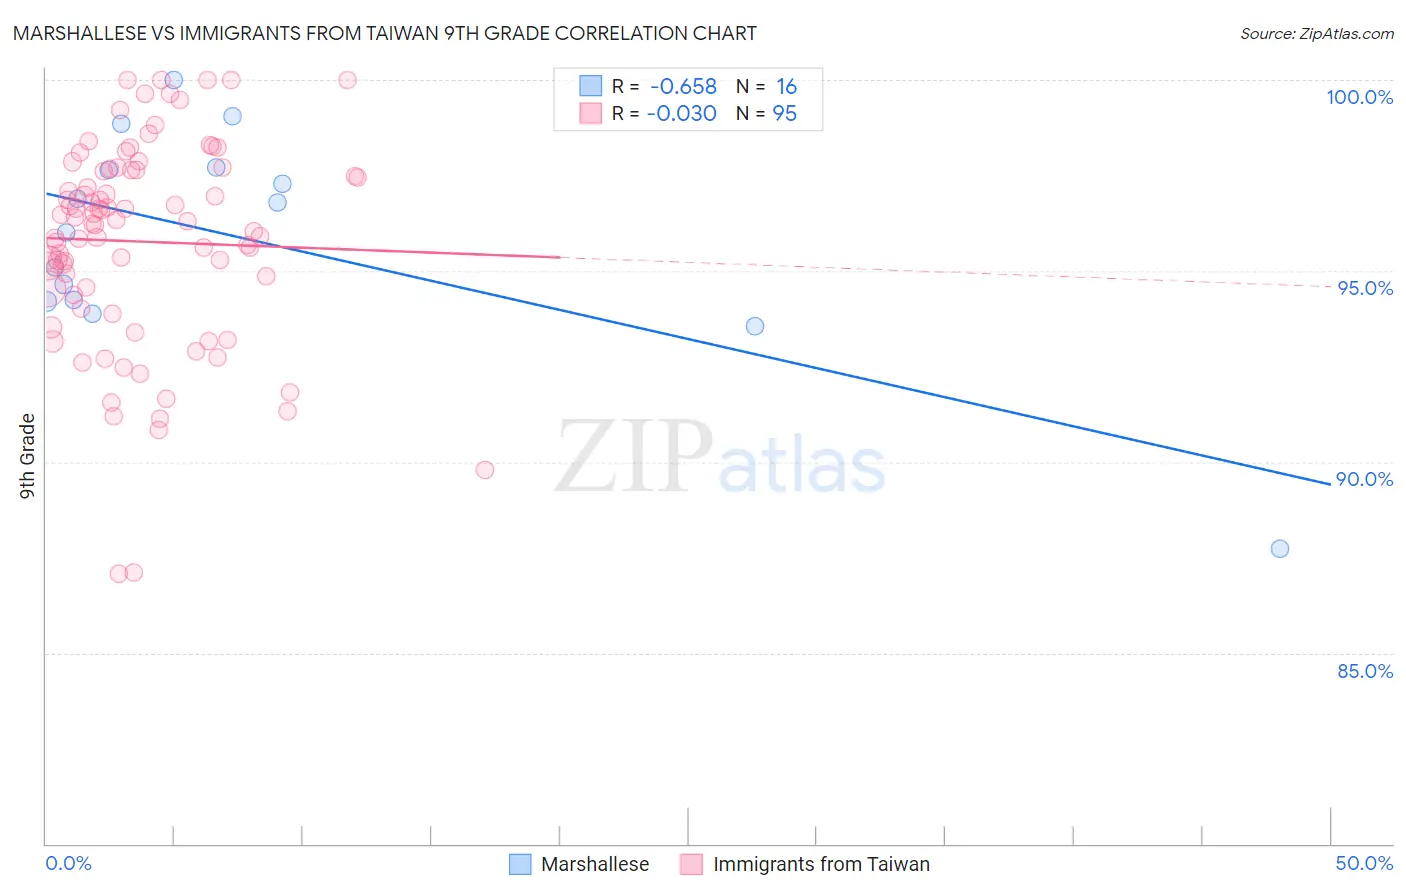
Marshallese vs Immigrants from Taiwan 9th Grade Correlation Chart
The statistical analysis conducted on geographies consisting of 14,761,315 people shows a significant negative correlation between the proportion of Marshallese and percentage of population with at least 9th grade education in the United States with a correlation coefficient (R) of -0.658 and weighted average of 94.7%. Similarly, the statistical analysis conducted on geographies consisting of 298,292,402 people shows no correlation between the proportion of Immigrants from Taiwan and percentage of population with at least 9th grade education in the United States with a correlation coefficient (R) of -0.030 and weighted average of 95.2%, a difference of 0.50%.
9th Grade Correlation Summary
| Measurement | Marshallese | Immigrants from Taiwan |
| Minimum | 87.7% | 87.1% |
| Maximum | 100.0% | 100.0% |
| Range | 12.3% | 12.9% |
| Mean | 95.8% | 95.8% |
| Median | 96.4% | 96.3% |
| Interquartile 25% (IQ1) | 94.2% | 94.4% |
| Interquartile 75% (IQ3) | 97.7% | 97.6% |
| Interquartile Range (IQR) | 3.5% | 3.3% |
| Standard Deviation (Sample) | 2.9% | 2.7% |
| Standard Deviation (Population) | 2.8% | 2.7% |
Similar Demographics by 9th Grade
Demographics Similar to Marshallese by 9th Grade
In terms of 9th grade, the demographic groups most similar to Marshallese are Panamanian (94.7%, a difference of 0.010%), Immigrants from Lebanon (94.7%, a difference of 0.010%), Immigrants from Northern Africa (94.7%, a difference of 0.020%), Paraguayan (94.7%, a difference of 0.020%), and Immigrants from Micronesia (94.7%, a difference of 0.030%).
| Demographics | Rating | Rank | 9th Grade |
| Immigrants | Albania | 34.5 /100 | #188 | Fair 94.8% |
| Immigrants | Argentina | 34.4 /100 | #189 | Fair 94.8% |
| Sudanese | 32.7 /100 | #190 | Fair 94.7% |
| Assyrians/Chaldeans/Syriacs | 32.0 /100 | #191 | Fair 94.7% |
| Immigrants | Northern Africa | 30.7 /100 | #192 | Fair 94.7% |
| Paraguayans | 30.1 /100 | #193 | Fair 94.7% |
| Panamanians | 29.0 /100 | #194 | Fair 94.7% |
| Marshallese | 27.9 /100 | #195 | Fair 94.7% |
| Immigrants | Lebanon | 27.2 /100 | #196 | Fair 94.7% |
| Immigrants | Micronesia | 24.7 /100 | #197 | Fair 94.7% |
| Hawaiians | 22.7 /100 | #198 | Fair 94.7% |
| Laotians | 21.0 /100 | #199 | Fair 94.6% |
| Immigrants | Zaire | 20.6 /100 | #200 | Fair 94.6% |
| Blacks/African Americans | 20.5 /100 | #201 | Fair 94.6% |
| Immigrants | Eastern Asia | 19.8 /100 | #202 | Poor 94.6% |
Demographics Similar to Immigrants from Taiwan by 9th Grade
In terms of 9th grade, the demographic groups most similar to Immigrants from Taiwan are Immigrants from Bosnia and Herzegovina (95.2%, a difference of 0.0%), Immigrants from Eastern Europe (95.2%, a difference of 0.010%), Immigrants from Greece (95.2%, a difference of 0.010%), Spanish (95.2%, a difference of 0.010%), and Immigrants from Russia (95.2%, a difference of 0.020%).
| Demographics | Rating | Rank | 9th Grade |
| Israelis | 90.4 /100 | #133 | Exceptional 95.3% |
| Immigrants | Israel | 89.6 /100 | #134 | Excellent 95.3% |
| Immigrants | Belarus | 88.9 /100 | #135 | Excellent 95.2% |
| Immigrants | Iran | 88.3 /100 | #136 | Excellent 95.2% |
| Hmong | 87.7 /100 | #137 | Excellent 95.2% |
| Immigrants | Russia | 86.6 /100 | #138 | Excellent 95.2% |
| Immigrants | Eastern Europe | 85.8 /100 | #139 | Excellent 95.2% |
| Immigrants | Taiwan | 85.3 /100 | #140 | Excellent 95.2% |
| Immigrants | Bosnia and Herzegovina | 85.2 /100 | #141 | Excellent 95.2% |
| Immigrants | Greece | 84.6 /100 | #142 | Excellent 95.2% |
| Spanish | 84.4 /100 | #143 | Excellent 95.2% |
| Yup'ik | 83.3 /100 | #144 | Excellent 95.2% |
| Pueblo | 82.2 /100 | #145 | Excellent 95.1% |
| Immigrants | Sri Lanka | 82.1 /100 | #146 | Excellent 95.1% |
| Choctaw | 81.9 /100 | #147 | Excellent 95.1% |