Marshallese vs Immigrants from Europe Single Father Poverty
COMPARE
Marshallese
Immigrants from Europe
Single Father Poverty
Single Father Poverty Comparison
Marshallese
Immigrants from Europe
16.9%
SINGLE FATHER POVERTY
3.1/ 100
METRIC RATING
234th/ 347
METRIC RANK
16.3%
SINGLE FATHER POVERTY
54.8/ 100
METRIC RATING
166th/ 347
METRIC RANK
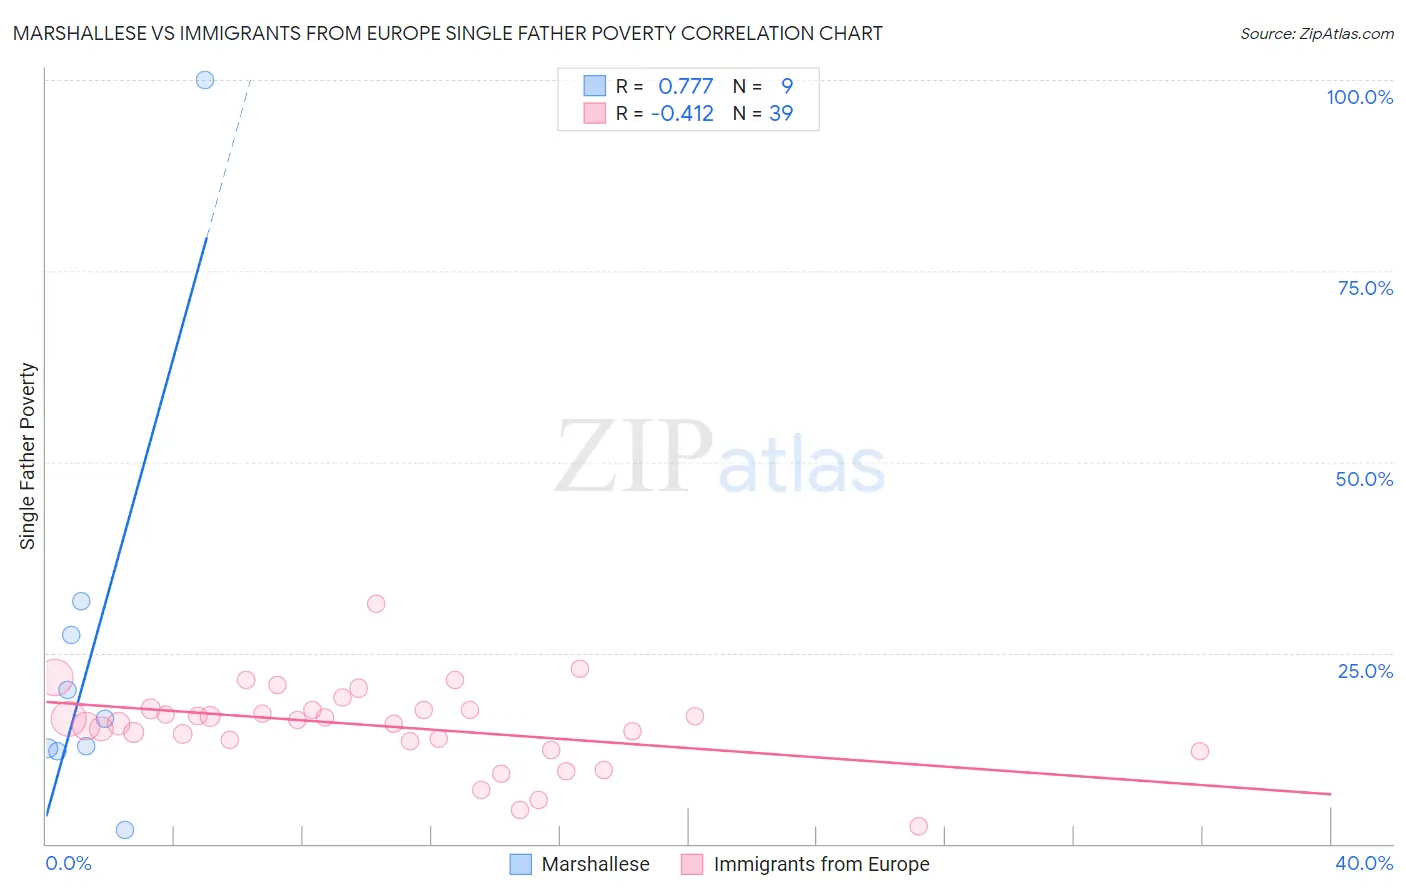
Marshallese vs Immigrants from Europe Single Father Poverty Correlation Chart
The statistical analysis conducted on geographies consisting of 13,927,336 people shows a strong positive correlation between the proportion of Marshallese and poverty level among single fathers in the United States with a correlation coefficient (R) of 0.777 and weighted average of 16.9%. Similarly, the statistical analysis conducted on geographies consisting of 399,898,147 people shows a moderate negative correlation between the proportion of Immigrants from Europe and poverty level among single fathers in the United States with a correlation coefficient (R) of -0.412 and weighted average of 16.3%, a difference of 4.0%.
Single Father Poverty Correlation Summary
| Measurement | Marshallese | Immigrants from Europe |
| Minimum | 1.9% | 2.4% |
| Maximum | 100.0% | 31.4% |
| Range | 98.1% | 29.0% |
| Mean | 26.1% | 15.4% |
| Median | 16.3% | 16.1% |
| Interquartile 25% (IQ1) | 12.3% | 13.5% |
| Interquartile 75% (IQ3) | 29.5% | 17.5% |
| Interquartile Range (IQR) | 17.2% | 4.0% |
| Standard Deviation (Sample) | 29.1% | 5.4% |
| Standard Deviation (Population) | 27.4% | 5.4% |
Similar Demographics by Single Father Poverty
Demographics Similar to Marshallese by Single Father Poverty
In terms of single father poverty, the demographic groups most similar to Marshallese are Senegalese (16.9%, a difference of 0.030%), Immigrants from Western Europe (16.9%, a difference of 0.10%), Immigrants from Germany (16.9%, a difference of 0.10%), Subsaharan African (16.9%, a difference of 0.10%), and Immigrants from Grenada (16.9%, a difference of 0.17%).
| Demographics | Rating | Rank | Single Father Poverty |
| British | 5.6 /100 | #227 | Tragic 16.8% |
| Belgians | 5.3 /100 | #228 | Tragic 16.8% |
| Israelis | 4.6 /100 | #229 | Tragic 16.8% |
| Immigrants | Trinidad and Tobago | 4.5 /100 | #230 | Tragic 16.8% |
| Spanish Americans | 3.7 /100 | #231 | Tragic 16.9% |
| Immigrants | Grenada | 3.7 /100 | #232 | Tragic 16.9% |
| Senegalese | 3.2 /100 | #233 | Tragic 16.9% |
| Marshallese | 3.1 /100 | #234 | Tragic 16.9% |
| Immigrants | Western Europe | 2.9 /100 | #235 | Tragic 16.9% |
| Immigrants | Germany | 2.9 /100 | #236 | Tragic 16.9% |
| Sub-Saharan Africans | 2.9 /100 | #237 | Tragic 16.9% |
| Immigrants | Saudi Arabia | 2.7 /100 | #238 | Tragic 16.9% |
| Bermudans | 2.6 /100 | #239 | Tragic 16.9% |
| Finns | 2.6 /100 | #240 | Tragic 16.9% |
| Czechs | 2.3 /100 | #241 | Tragic 17.0% |
Demographics Similar to Immigrants from Europe by Single Father Poverty
In terms of single father poverty, the demographic groups most similar to Immigrants from Europe are Guyanese (16.3%, a difference of 0.010%), Immigrants from Bangladesh (16.3%, a difference of 0.010%), Immigrants from Costa Rica (16.3%, a difference of 0.040%), Yugoslavian (16.3%, a difference of 0.040%), and Ugandan (16.3%, a difference of 0.050%).
| Demographics | Rating | Rank | Single Father Poverty |
| Belizeans | 59.9 /100 | #159 | Average 16.2% |
| Immigrants | Sudan | 59.8 /100 | #160 | Average 16.2% |
| Estonians | 56.7 /100 | #161 | Average 16.2% |
| Ugandans | 55.9 /100 | #162 | Average 16.3% |
| Immigrants | Costa Rica | 55.7 /100 | #163 | Average 16.3% |
| Guyanese | 55.2 /100 | #164 | Average 16.3% |
| Immigrants | Bangladesh | 55.1 /100 | #165 | Average 16.3% |
| Immigrants | Europe | 54.8 /100 | #166 | Average 16.3% |
| Yugoslavians | 53.9 /100 | #167 | Average 16.3% |
| Costa Ricans | 53.6 /100 | #168 | Average 16.3% |
| Northern Europeans | 52.8 /100 | #169 | Average 16.3% |
| Scandinavians | 52.3 /100 | #170 | Average 16.3% |
| Immigrants | Morocco | 50.7 /100 | #171 | Average 16.3% |
| Immigrants | Sierra Leone | 50.1 /100 | #172 | Average 16.3% |
| Immigrants | St. Vincent and the Grenadines | 50.0 /100 | #173 | Average 16.3% |