Lumbee vs Native/Alaskan Hearing Disability
COMPARE
Lumbee
Native/Alaskan
Hearing Disability
Hearing Disability Comparison
Lumbee
Natives/Alaskans
4.1%
HEARING DISABILITY
0.0/ 100
METRIC RATING
325th/ 347
METRIC RANK
4.2%
HEARING DISABILITY
0.0/ 100
METRIC RATING
330th/ 347
METRIC RANK
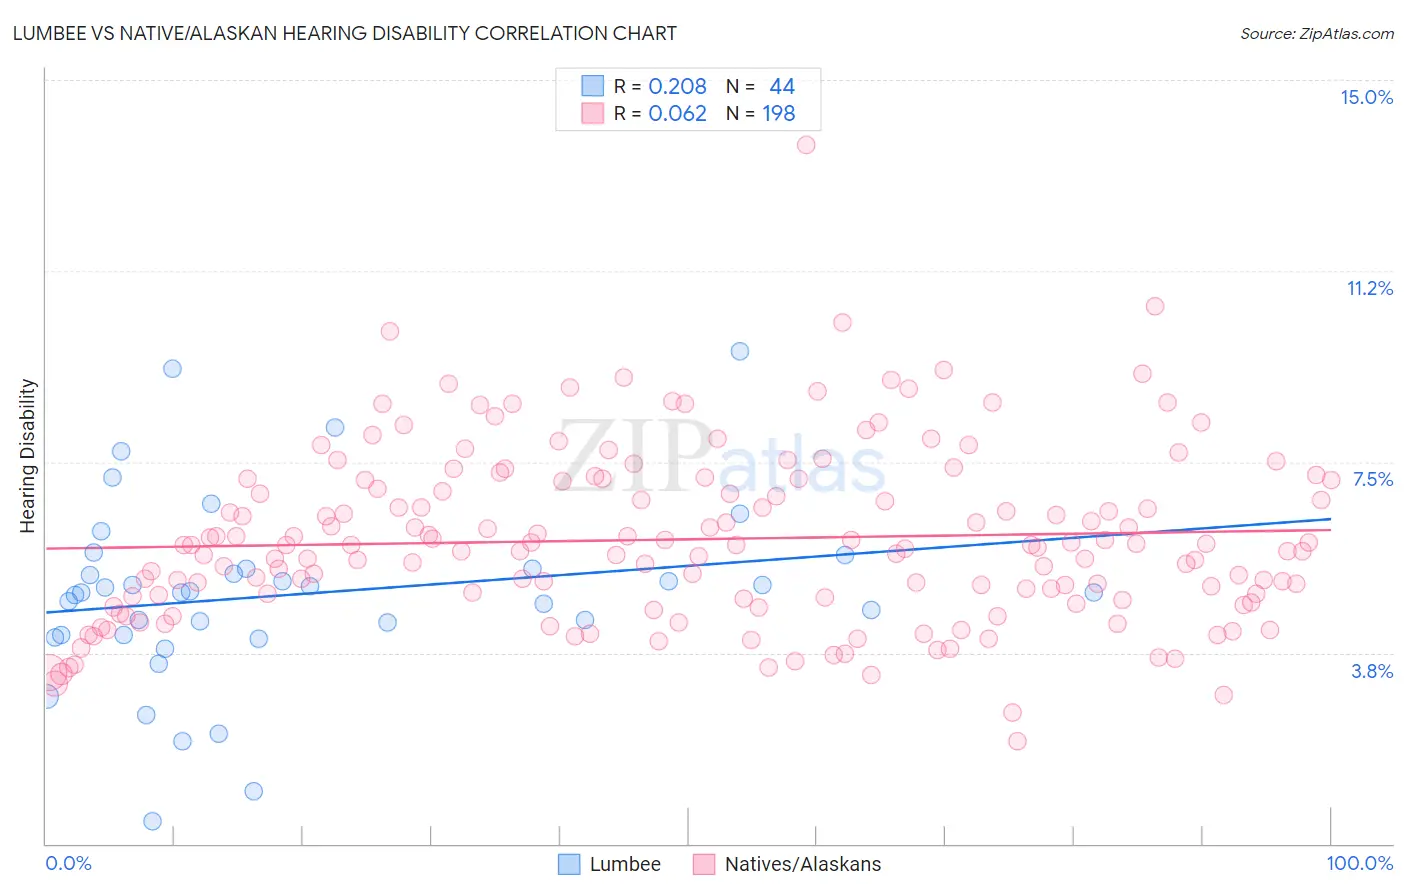
Lumbee vs Native/Alaskan Hearing Disability Correlation Chart
The statistical analysis conducted on geographies consisting of 92,274,524 people shows a weak positive correlation between the proportion of Lumbee and percentage of population with hearing disability in the United States with a correlation coefficient (R) of 0.208 and weighted average of 4.1%. Similarly, the statistical analysis conducted on geographies consisting of 512,663,343 people shows a slight positive correlation between the proportion of Natives/Alaskans and percentage of population with hearing disability in the United States with a correlation coefficient (R) of 0.062 and weighted average of 4.2%, a difference of 2.2%.
Hearing Disability Correlation Summary
| Measurement | Lumbee | Native/Alaskan |
| Minimum | 0.45% | 2.0% |
| Maximum | 9.7% | 13.7% |
| Range | 9.2% | 11.7% |
| Mean | 4.9% | 6.0% |
| Median | 4.9% | 5.9% |
| Interquartile 25% (IQ1) | 4.1% | 4.8% |
| Interquartile 75% (IQ3) | 5.4% | 7.2% |
| Interquartile Range (IQR) | 1.3% | 2.3% |
| Standard Deviation (Sample) | 1.8% | 1.7% |
| Standard Deviation (Population) | 1.8% | 1.7% |
Demographics Similar to Lumbee and Natives/Alaskans by Hearing Disability
In terms of hearing disability, the demographic groups most similar to Lumbee are Potawatomi (4.1%, a difference of 0.29%), Osage (4.1%, a difference of 0.32%), Apache (4.1%, a difference of 0.39%), Seminole (4.1%, a difference of 0.51%), and Paiute (4.1%, a difference of 0.77%). Similarly, the demographic groups most similar to Natives/Alaskans are Cherokee (4.2%, a difference of 0.15%), Crow (4.2%, a difference of 0.79%), Tohono O'odham (4.2%, a difference of 0.80%), Houma (4.2%, a difference of 0.83%), and Arapaho (4.1%, a difference of 1.2%).
| Demographics | Rating | Rank | Hearing Disability |
| Comanche | 0.0 /100 | #317 | Tragic 4.0% |
| Cheyenne | 0.0 /100 | #318 | Tragic 4.0% |
| Chippewa | 0.0 /100 | #319 | Tragic 4.0% |
| Shoshone | 0.0 /100 | #320 | Tragic 4.0% |
| Paiute | 0.0 /100 | #321 | Tragic 4.1% |
| Seminole | 0.0 /100 | #322 | Tragic 4.1% |
| Apache | 0.0 /100 | #323 | Tragic 4.1% |
| Osage | 0.0 /100 | #324 | Tragic 4.1% |
| Lumbee | 0.0 /100 | #325 | Tragic 4.1% |
| Potawatomi | 0.0 /100 | #326 | Tragic 4.1% |
| Arapaho | 0.0 /100 | #327 | Tragic 4.1% |
| Tohono O'odham | 0.0 /100 | #328 | Tragic 4.2% |
| Crow | 0.0 /100 | #329 | Tragic 4.2% |
| Natives/Alaskans | 0.0 /100 | #330 | Tragic 4.2% |
| Cherokee | 0.0 /100 | #331 | Tragic 4.2% |
| Houma | 0.0 /100 | #332 | Tragic 4.2% |
| Dutch West Indians | 0.0 /100 | #333 | Tragic 4.3% |
| Aleuts | 0.0 /100 | #334 | Tragic 4.3% |
| Kiowa | 0.0 /100 | #335 | Tragic 4.3% |
| Creek | 0.0 /100 | #336 | Tragic 4.4% |
| Chickasaw | 0.0 /100 | #337 | Tragic 4.5% |