Lumbee vs Native/Alaskan Unemployment Among Ages 30 to 34 years
COMPARE
Lumbee
Native/Alaskan
Unemployment Among Ages 30 to 34 years
Unemployment Among Ages 30 to 34 years Comparison
Lumbee
Natives/Alaskans
7.1%
UNEMPLOYMENT AMONG AGES 30 TO 34 YEARS
0.0/ 100
METRIC RATING
314th/ 347
METRIC RANK
8.2%
UNEMPLOYMENT AMONG AGES 30 TO 34 YEARS
0.0/ 100
METRIC RATING
332nd/ 347
METRIC RANK
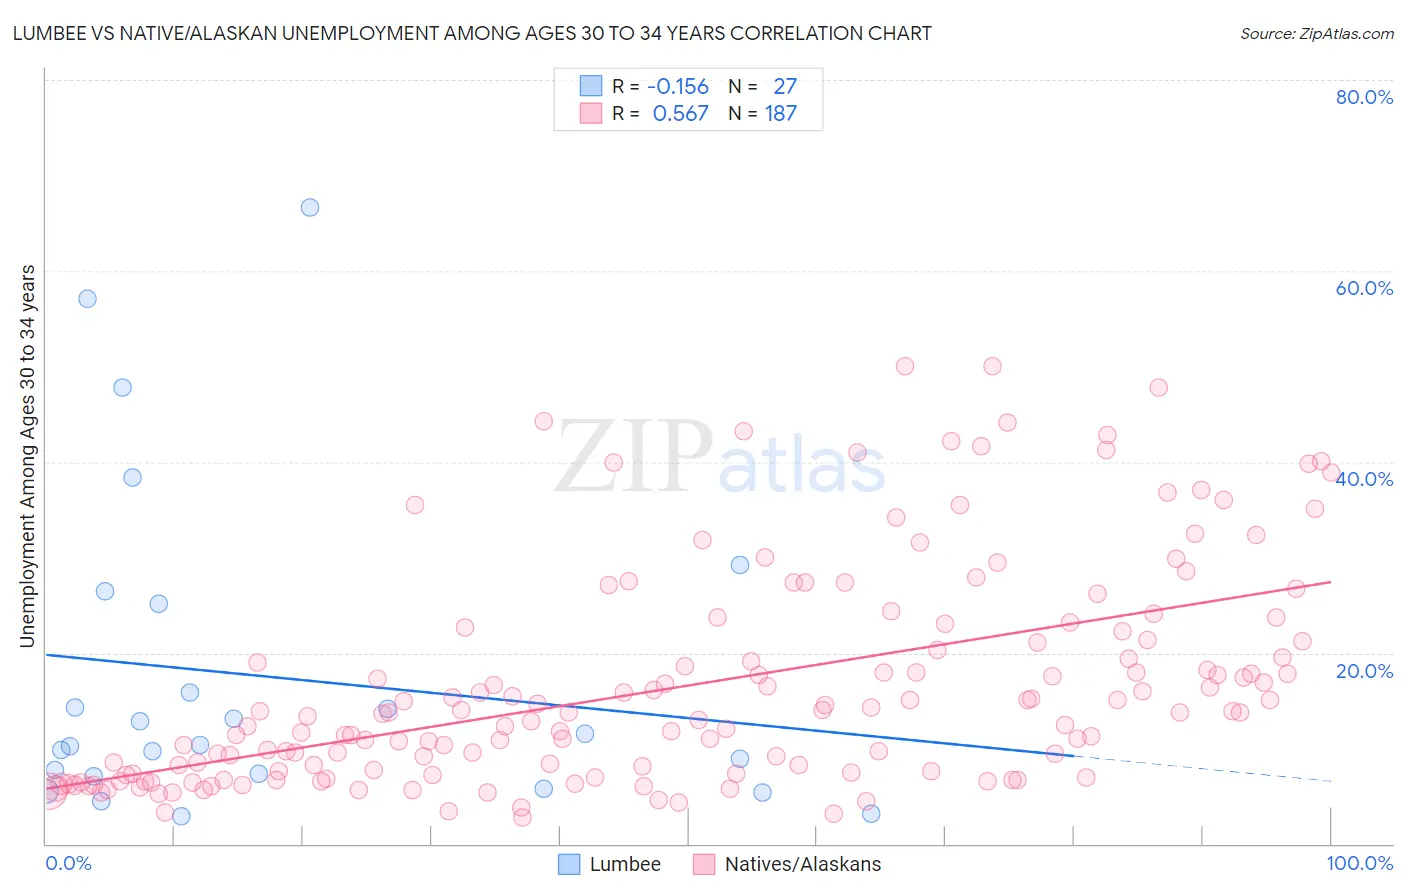
Lumbee vs Native/Alaskan Unemployment Among Ages 30 to 34 years Correlation Chart
The statistical analysis conducted on geographies consisting of 89,655,506 people shows a poor negative correlation between the proportion of Lumbee and unemployment rate among population between the ages 30 and 34 in the United States with a correlation coefficient (R) of -0.156 and weighted average of 7.1%. Similarly, the statistical analysis conducted on geographies consisting of 466,883,769 people shows a substantial positive correlation between the proportion of Natives/Alaskans and unemployment rate among population between the ages 30 and 34 in the United States with a correlation coefficient (R) of 0.567 and weighted average of 8.2%, a difference of 16.7%.
Unemployment Among Ages 30 to 34 years Correlation Summary
| Measurement | Lumbee | Native/Alaskan |
| Minimum | 2.9% | 2.7% |
| Maximum | 66.7% | 50.0% |
| Range | 63.8% | 47.3% |
| Mean | 17.4% | 16.5% |
| Median | 10.3% | 13.7% |
| Interquartile 25% (IQ1) | 7.1% | 7.4% |
| Interquartile 75% (IQ3) | 25.1% | 21.4% |
| Interquartile Range (IQR) | 18.0% | 14.0% |
| Standard Deviation (Sample) | 16.8% | 11.3% |
| Standard Deviation (Population) | 16.5% | 11.3% |
Demographics Similar to Lumbee and Natives/Alaskans by Unemployment Among Ages 30 to 34 years
In terms of unemployment among ages 30 to 34 years, the demographic groups most similar to Lumbee are Ute (7.0%, a difference of 0.21%), Aleut (7.1%, a difference of 0.37%), Houma (7.2%, a difference of 1.4%), Immigrants from Cabo Verde (7.2%, a difference of 1.7%), and Black/African American (7.2%, a difference of 1.8%). Similarly, the demographic groups most similar to Natives/Alaskans are Pueblo (8.3%, a difference of 0.43%), Sioux (8.0%, a difference of 2.6%), Shoshone (7.9%, a difference of 4.1%), Cheyenne (7.8%, a difference of 5.1%), and Chippewa (7.8%, a difference of 6.2%).
| Demographics | Rating | Rank | Unemployment Among Ages 30 to 34 years |
| Ute | 0.0 /100 | #313 | Tragic 7.0% |
| Lumbee | 0.0 /100 | #314 | Tragic 7.1% |
| Aleuts | 0.0 /100 | #315 | Tragic 7.1% |
| Houma | 0.0 /100 | #316 | Tragic 7.2% |
| Immigrants | Cabo Verde | 0.0 /100 | #317 | Tragic 7.2% |
| Blacks/African Americans | 0.0 /100 | #318 | Tragic 7.2% |
| Guyanese | 0.0 /100 | #319 | Tragic 7.2% |
| Cape Verdeans | 0.0 /100 | #320 | Tragic 7.2% |
| Immigrants | Guyana | 0.0 /100 | #321 | Tragic 7.2% |
| Marshallese | 0.0 /100 | #322 | Tragic 7.2% |
| Immigrants | Yemen | 0.0 /100 | #323 | Tragic 7.3% |
| Immigrants | Dominica | 0.0 /100 | #324 | Tragic 7.3% |
| Apache | 0.0 /100 | #325 | Tragic 7.3% |
| Dominicans | 0.0 /100 | #326 | Tragic 7.7% |
| Immigrants | Dominican Republic | 0.0 /100 | #327 | Tragic 7.7% |
| Chippewa | 0.0 /100 | #328 | Tragic 7.8% |
| Cheyenne | 0.0 /100 | #329 | Tragic 7.8% |
| Shoshone | 0.0 /100 | #330 | Tragic 7.9% |
| Sioux | 0.0 /100 | #331 | Tragic 8.0% |
| Natives/Alaskans | 0.0 /100 | #332 | Tragic 8.2% |
| Pueblo | 0.0 /100 | #333 | Tragic 8.3% |