Iranian vs Chickasaw Single Male Poverty
COMPARE
Iranian
Chickasaw
Single Male Poverty
Single Male Poverty Comparison
Iranians
Chickasaw
11.4%
SINGLE MALE POVERTY
100.0/ 100
METRIC RATING
30th/ 347
METRIC RANK
16.3%
SINGLE MALE POVERTY
0.0/ 100
METRIC RATING
318th/ 347
METRIC RANK
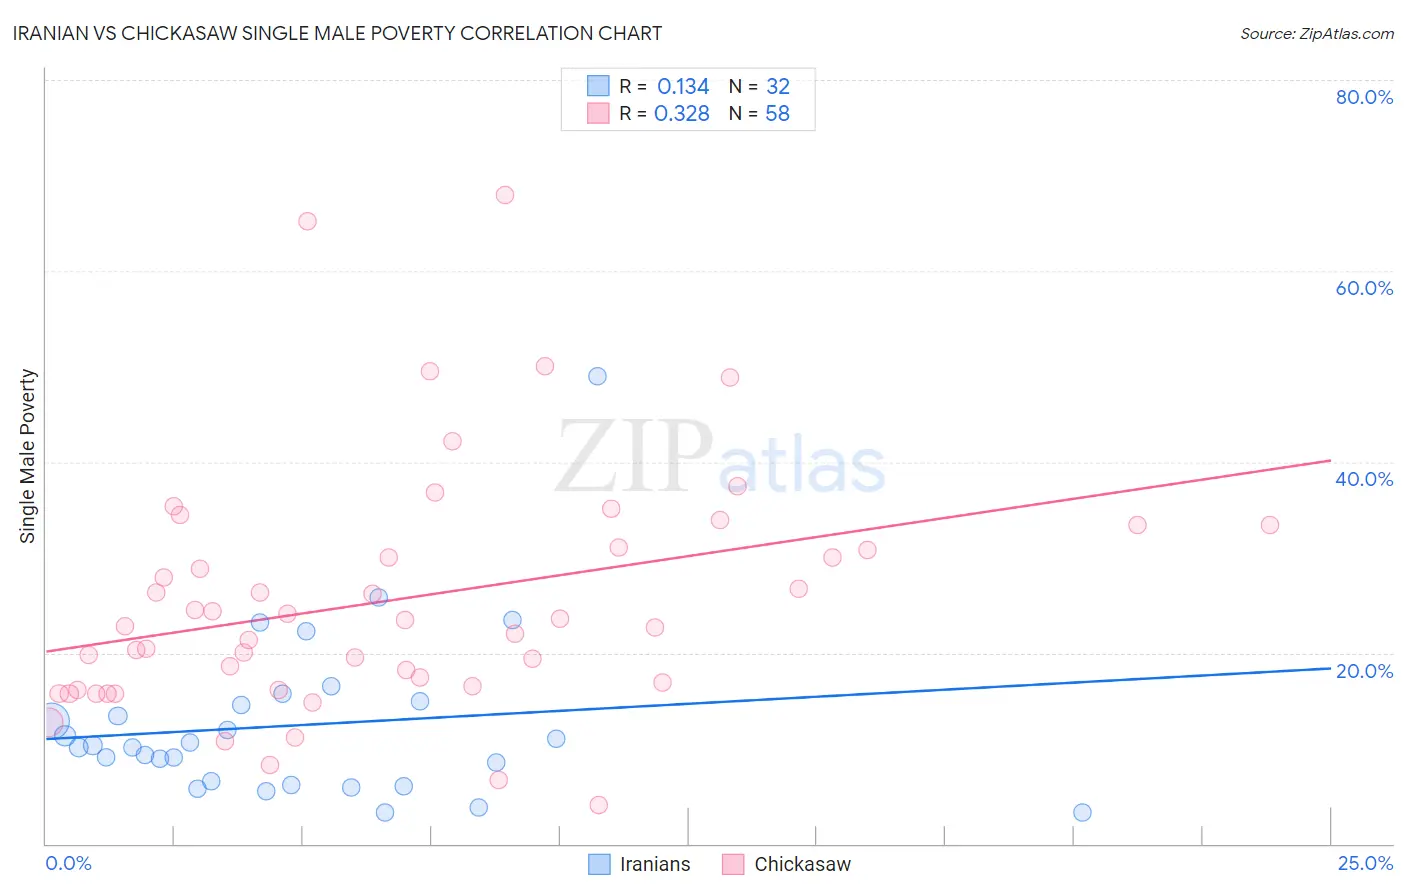
Iranian vs Chickasaw Single Male Poverty Correlation Chart
The statistical analysis conducted on geographies consisting of 284,868,463 people shows a poor positive correlation between the proportion of Iranians and poverty level among single males in the United States with a correlation coefficient (R) of 0.134 and weighted average of 11.4%. Similarly, the statistical analysis conducted on geographies consisting of 140,053,704 people shows a mild positive correlation between the proportion of Chickasaw and poverty level among single males in the United States with a correlation coefficient (R) of 0.328 and weighted average of 16.3%, a difference of 43.1%.
Single Male Poverty Correlation Summary
| Measurement | Iranian | Chickasaw |
| Minimum | 3.2% | 4.0% |
| Maximum | 49.0% | 67.9% |
| Range | 45.8% | 63.9% |
| Mean | 12.4% | 25.6% |
| Median | 10.2% | 23.1% |
| Interquartile 25% (IQ1) | 6.4% | 16.6% |
| Interquartile 75% (IQ3) | 14.8% | 31.0% |
| Interquartile Range (IQR) | 8.4% | 14.5% |
| Standard Deviation (Sample) | 8.9% | 12.7% |
| Standard Deviation (Population) | 8.8% | 12.6% |
Similar Demographics by Single Male Poverty
Demographics Similar to Iranians by Single Male Poverty
In terms of single male poverty, the demographic groups most similar to Iranians are Immigrants from Egypt (11.4%, a difference of 0.060%), Immigrants from Iran (11.4%, a difference of 0.090%), Immigrants from Asia (11.4%, a difference of 0.16%), Immigrants from Eastern Asia (11.4%, a difference of 0.18%), and Immigrants from China (11.4%, a difference of 0.23%).
| Demographics | Rating | Rank | Single Male Poverty |
| Bolivians | 100.0 /100 | #23 | Exceptional 11.2% |
| Indians (Asian) | 100.0 /100 | #24 | Exceptional 11.3% |
| Maltese | 100.0 /100 | #25 | Exceptional 11.3% |
| Immigrants | Japan | 100.0 /100 | #26 | Exceptional 11.3% |
| Immigrants | China | 100.0 /100 | #27 | Exceptional 11.4% |
| Immigrants | Asia | 100.0 /100 | #28 | Exceptional 11.4% |
| Immigrants | Egypt | 100.0 /100 | #29 | Exceptional 11.4% |
| Iranians | 100.0 /100 | #30 | Exceptional 11.4% |
| Immigrants | Iran | 100.0 /100 | #31 | Exceptional 11.4% |
| Immigrants | Eastern Asia | 100.0 /100 | #32 | Exceptional 11.4% |
| Immigrants | Vietnam | 100.0 /100 | #33 | Exceptional 11.4% |
| Immigrants | Ethiopia | 100.0 /100 | #34 | Exceptional 11.4% |
| Immigrants | South Eastern Asia | 100.0 /100 | #35 | Exceptional 11.4% |
| Immigrants | Serbia | 100.0 /100 | #36 | Exceptional 11.4% |
| Immigrants | Singapore | 100.0 /100 | #37 | Exceptional 11.4% |
Demographics Similar to Chickasaw by Single Male Poverty
In terms of single male poverty, the demographic groups most similar to Chickasaw are Chippewa (16.4%, a difference of 0.30%), Marshallese (16.4%, a difference of 0.78%), Black/African American (16.2%, a difference of 0.80%), Osage (16.5%, a difference of 0.91%), and Dutch West Indian (16.1%, a difference of 1.1%).
| Demographics | Rating | Rank | Single Male Poverty |
| Seminole | 0.0 /100 | #311 | Tragic 16.0% |
| Comanche | 0.0 /100 | #312 | Tragic 16.0% |
| Cherokee | 0.0 /100 | #313 | Tragic 16.1% |
| Alaskan Athabascans | 0.0 /100 | #314 | Tragic 16.1% |
| Cheyenne | 0.0 /100 | #315 | Tragic 16.1% |
| Dutch West Indians | 0.0 /100 | #316 | Tragic 16.1% |
| Blacks/African Americans | 0.0 /100 | #317 | Tragic 16.2% |
| Chickasaw | 0.0 /100 | #318 | Tragic 16.3% |
| Chippewa | 0.0 /100 | #319 | Tragic 16.4% |
| Marshallese | 0.0 /100 | #320 | Tragic 16.4% |
| Osage | 0.0 /100 | #321 | Tragic 16.5% |
| Shoshone | 0.0 /100 | #322 | Tragic 16.7% |
| Creek | 0.0 /100 | #323 | Tragic 16.8% |
| Immigrants | Yemen | 0.0 /100 | #324 | Tragic 16.9% |
| Choctaw | 0.0 /100 | #325 | Tragic 17.0% |