Iranian vs White/Caucasian Single Male Poverty
COMPARE
Iranian
White/Caucasian
Single Male Poverty
Single Male Poverty Comparison
Iranians
Whites/Caucasians
11.4%
SINGLE MALE POVERTY
100.0/ 100
METRIC RATING
30th/ 347
METRIC RANK
14.5%
SINGLE MALE POVERTY
0.0/ 100
METRIC RATING
288th/ 347
METRIC RANK
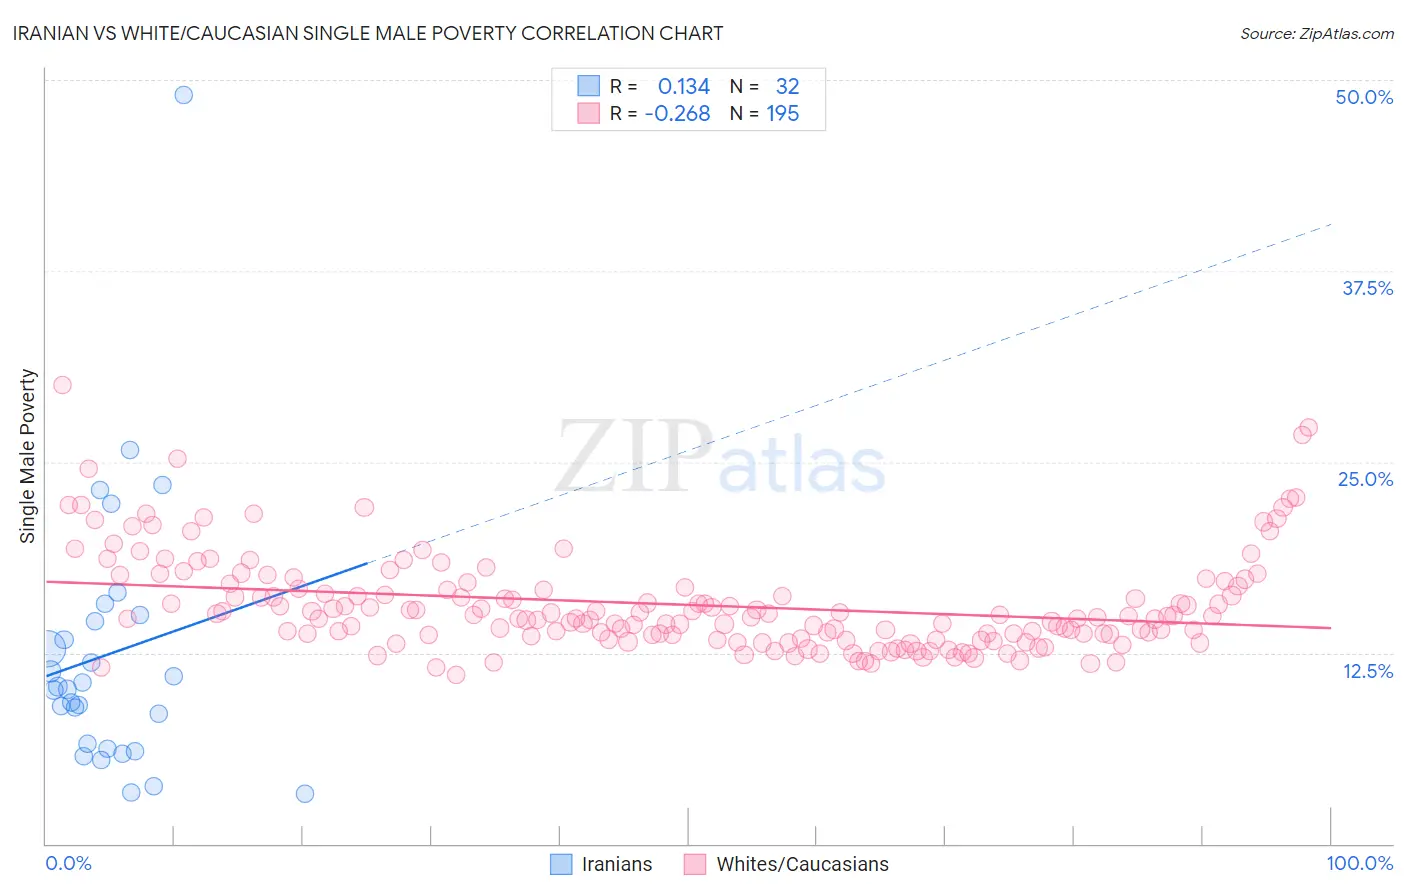
Iranian vs White/Caucasian Single Male Poverty Correlation Chart
The statistical analysis conducted on geographies consisting of 284,868,463 people shows a poor positive correlation between the proportion of Iranians and poverty level among single males in the United States with a correlation coefficient (R) of 0.134 and weighted average of 11.4%. Similarly, the statistical analysis conducted on geographies consisting of 478,066,159 people shows a weak negative correlation between the proportion of Whites/Caucasians and poverty level among single males in the United States with a correlation coefficient (R) of -0.268 and weighted average of 14.5%, a difference of 27.0%.
Single Male Poverty Correlation Summary
| Measurement | Iranian | White/Caucasian |
| Minimum | 3.2% | 11.1% |
| Maximum | 49.0% | 30.0% |
| Range | 45.8% | 19.0% |
| Mean | 12.4% | 15.6% |
| Median | 10.2% | 14.8% |
| Interquartile 25% (IQ1) | 6.4% | 13.6% |
| Interquartile 75% (IQ3) | 14.8% | 16.8% |
| Interquartile Range (IQR) | 8.4% | 3.2% |
| Standard Deviation (Sample) | 8.9% | 3.2% |
| Standard Deviation (Population) | 8.8% | 3.2% |
Similar Demographics by Single Male Poverty
Demographics Similar to Iranians by Single Male Poverty
In terms of single male poverty, the demographic groups most similar to Iranians are Immigrants from Egypt (11.4%, a difference of 0.060%), Immigrants from Iran (11.4%, a difference of 0.090%), Immigrants from Asia (11.4%, a difference of 0.16%), Immigrants from Eastern Asia (11.4%, a difference of 0.18%), and Immigrants from China (11.4%, a difference of 0.23%).
| Demographics | Rating | Rank | Single Male Poverty |
| Bolivians | 100.0 /100 | #23 | Exceptional 11.2% |
| Indians (Asian) | 100.0 /100 | #24 | Exceptional 11.3% |
| Maltese | 100.0 /100 | #25 | Exceptional 11.3% |
| Immigrants | Japan | 100.0 /100 | #26 | Exceptional 11.3% |
| Immigrants | China | 100.0 /100 | #27 | Exceptional 11.4% |
| Immigrants | Asia | 100.0 /100 | #28 | Exceptional 11.4% |
| Immigrants | Egypt | 100.0 /100 | #29 | Exceptional 11.4% |
| Iranians | 100.0 /100 | #30 | Exceptional 11.4% |
| Immigrants | Iran | 100.0 /100 | #31 | Exceptional 11.4% |
| Immigrants | Eastern Asia | 100.0 /100 | #32 | Exceptional 11.4% |
| Immigrants | Vietnam | 100.0 /100 | #33 | Exceptional 11.4% |
| Immigrants | Ethiopia | 100.0 /100 | #34 | Exceptional 11.4% |
| Immigrants | South Eastern Asia | 100.0 /100 | #35 | Exceptional 11.4% |
| Immigrants | Serbia | 100.0 /100 | #36 | Exceptional 11.4% |
| Immigrants | Singapore | 100.0 /100 | #37 | Exceptional 11.4% |
Demographics Similar to Whites/Caucasians by Single Male Poverty
In terms of single male poverty, the demographic groups most similar to Whites/Caucasians are Iroquois (14.5%, a difference of 0.0%), Immigrants from Dominica (14.5%, a difference of 0.090%), Celtic (14.5%, a difference of 0.13%), U.S. Virgin Islander (14.5%, a difference of 0.31%), and French (14.4%, a difference of 0.45%).
| Demographics | Rating | Rank | Single Male Poverty |
| Hispanics or Latinos | 0.0 /100 | #281 | Tragic 14.2% |
| Spanish Americans | 0.0 /100 | #282 | Tragic 14.2% |
| Yaqui | 0.0 /100 | #283 | Tragic 14.2% |
| Immigrants | Bahamas | 0.0 /100 | #284 | Tragic 14.4% |
| French | 0.0 /100 | #285 | Tragic 14.4% |
| Celtics | 0.0 /100 | #286 | Tragic 14.5% |
| Iroquois | 0.0 /100 | #287 | Tragic 14.5% |
| Whites/Caucasians | 0.0 /100 | #288 | Tragic 14.5% |
| Immigrants | Dominica | 0.0 /100 | #289 | Tragic 14.5% |
| U.S. Virgin Islanders | 0.0 /100 | #290 | Tragic 14.5% |
| Bahamians | 0.0 /100 | #291 | Tragic 14.6% |
| Immigrants | Nonimmigrants | 0.0 /100 | #292 | Tragic 14.6% |
| French Canadians | 0.0 /100 | #293 | Tragic 14.6% |
| Ottawa | 0.0 /100 | #294 | Tragic 14.6% |
| Scotch-Irish | 0.0 /100 | #295 | Tragic 14.7% |