Immigrants vs Yuman Householder Income Ages 25 - 44 years
COMPARE
Immigrants
Yuman
Householder Income Ages 25 - 44 years
Householder Income Ages 25 - 44 years Comparison
Immigrants
Yuman
$94,423
HOUSEHOLDER INCOME AGES 25 - 44 YEARS
48.0/ 100
METRIC RATING
176th/ 347
METRIC RANK
$72,956
HOUSEHOLDER INCOME AGES 25 - 44 YEARS
0.0/ 100
METRIC RATING
339th/ 347
METRIC RANK
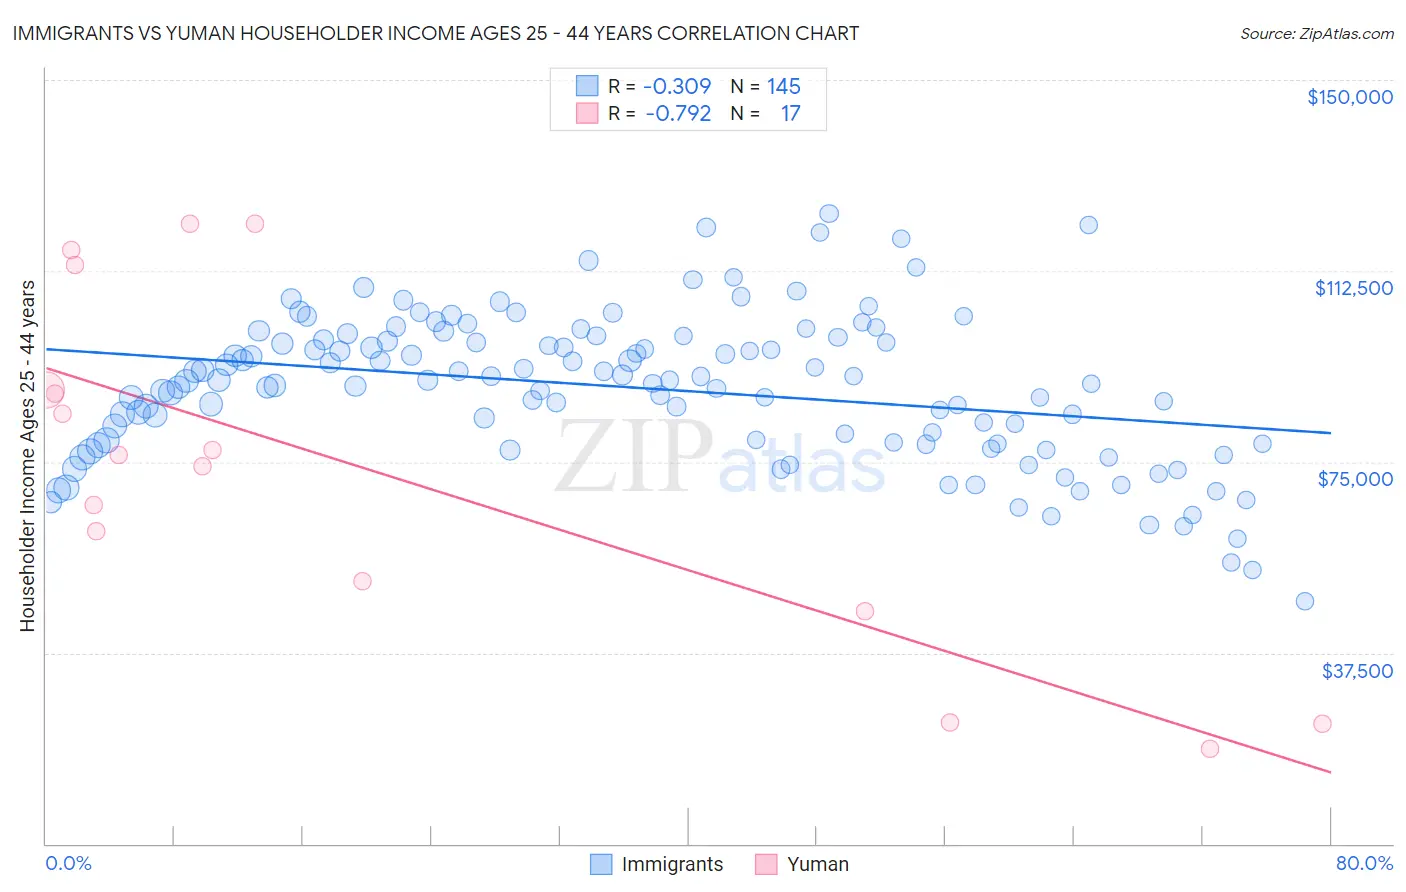
Immigrants vs Yuman Householder Income Ages 25 - 44 years Correlation Chart
The statistical analysis conducted on geographies consisting of 570,849,729 people shows a mild negative correlation between the proportion of Immigrants and household income with householder between the ages 25 and 44 in the United States with a correlation coefficient (R) of -0.309 and weighted average of $94,423. Similarly, the statistical analysis conducted on geographies consisting of 40,597,364 people shows a strong negative correlation between the proportion of Yuman and household income with householder between the ages 25 and 44 in the United States with a correlation coefficient (R) of -0.792 and weighted average of $72,956, a difference of 29.4%.
Householder Income Ages 25 - 44 years Correlation Summary
| Measurement | Immigrants | Yuman |
| Minimum | $47,510 | $18,542 |
| Maximum | $123,721 | $121,667 |
| Range | $76,211 | $103,125 |
| Mean | $89,554 | $73,782 |
| Median | $91,017 | $76,250 |
| Interquartile 25% (IQ1) | $78,698 | $48,591 |
| Interquartile 75% (IQ3) | $99,239 | $101,410 |
| Interquartile Range (IQR) | $20,541 | $52,819 |
| Standard Deviation (Sample) | $14,494 | $33,681 |
| Standard Deviation (Population) | $14,444 | $32,676 |
Similar Demographics by Householder Income Ages 25 - 44 years
Demographics Similar to Immigrants by Householder Income Ages 25 - 44 years
In terms of householder income ages 25 - 44 years, the demographic groups most similar to Immigrants are English ($94,429, a difference of 0.010%), Colombian ($94,565, a difference of 0.15%), Belgian ($94,262, a difference of 0.17%), Finnish ($94,610, a difference of 0.20%), and Scottish ($94,622, a difference of 0.21%).
| Demographics | Rating | Rank | Householder Income Ages 25 - 44 years |
| Native Hawaiians | 56.8 /100 | #169 | Average $95,058 |
| Slovaks | 56.4 /100 | #170 | Average $95,032 |
| Immigrants | Armenia | 54.2 /100 | #171 | Average $94,867 |
| Scottish | 50.8 /100 | #172 | Average $94,622 |
| Finns | 50.6 /100 | #173 | Average $94,610 |
| Colombians | 50.0 /100 | #174 | Average $94,565 |
| English | 48.1 /100 | #175 | Average $94,429 |
| Immigrants | Immigrants | 48.0 /100 | #176 | Average $94,423 |
| Belgians | 45.8 /100 | #177 | Average $94,262 |
| Immigrants | South America | 42.8 /100 | #178 | Average $94,042 |
| French Canadians | 38.2 /100 | #179 | Fair $93,694 |
| French | 37.8 /100 | #180 | Fair $93,665 |
| Puget Sound Salish | 37.7 /100 | #181 | Fair $93,661 |
| Uruguayans | 37.3 /100 | #182 | Fair $93,631 |
| Guamanians/Chamorros | 36.5 /100 | #183 | Fair $93,569 |
Demographics Similar to Yuman by Householder Income Ages 25 - 44 years
In terms of householder income ages 25 - 44 years, the demographic groups most similar to Yuman are Immigrants from Yemen ($73,043, a difference of 0.12%), Black/African American ($73,370, a difference of 0.57%), Yup'ik ($73,688, a difference of 1.0%), Immigrants from Congo ($72,178, a difference of 1.1%), and Arapaho ($71,697, a difference of 1.8%).
| Demographics | Rating | Rank | Householder Income Ages 25 - 44 years |
| Bahamians | 0.0 /100 | #332 | Tragic $75,395 |
| Hopi | 0.0 /100 | #333 | Tragic $75,002 |
| Creek | 0.0 /100 | #334 | Tragic $74,847 |
| Kiowa | 0.0 /100 | #335 | Tragic $74,776 |
| Yup'ik | 0.0 /100 | #336 | Tragic $73,688 |
| Blacks/African Americans | 0.0 /100 | #337 | Tragic $73,370 |
| Immigrants | Yemen | 0.0 /100 | #338 | Tragic $73,043 |
| Yuman | 0.0 /100 | #339 | Tragic $72,956 |
| Immigrants | Congo | 0.0 /100 | #340 | Tragic $72,178 |
| Arapaho | 0.0 /100 | #341 | Tragic $71,697 |
| Crow | 0.0 /100 | #342 | Tragic $71,337 |
| Tohono O'odham | 0.0 /100 | #343 | Tragic $69,068 |
| Pueblo | 0.0 /100 | #344 | Tragic $68,910 |
| Navajo | 0.0 /100 | #345 | Tragic $66,529 |
| Puerto Ricans | 0.0 /100 | #346 | Tragic $65,996 |