Immigrants from Sudan vs Blackfeet Married-Couple Family Poverty
COMPARE
Immigrants from Sudan
Blackfeet
Married-Couple Family Poverty
Married-Couple Family Poverty Comparison
Immigrants from Sudan
Blackfeet
5.7%
MARRIED-COUPLE FAMILY POVERTY
3.5/ 100
METRIC RATING
235th/ 347
METRIC RANK
6.2%
MARRIED-COUPLE FAMILY POVERTY
0.2/ 100
METRIC RATING
265th/ 347
METRIC RANK
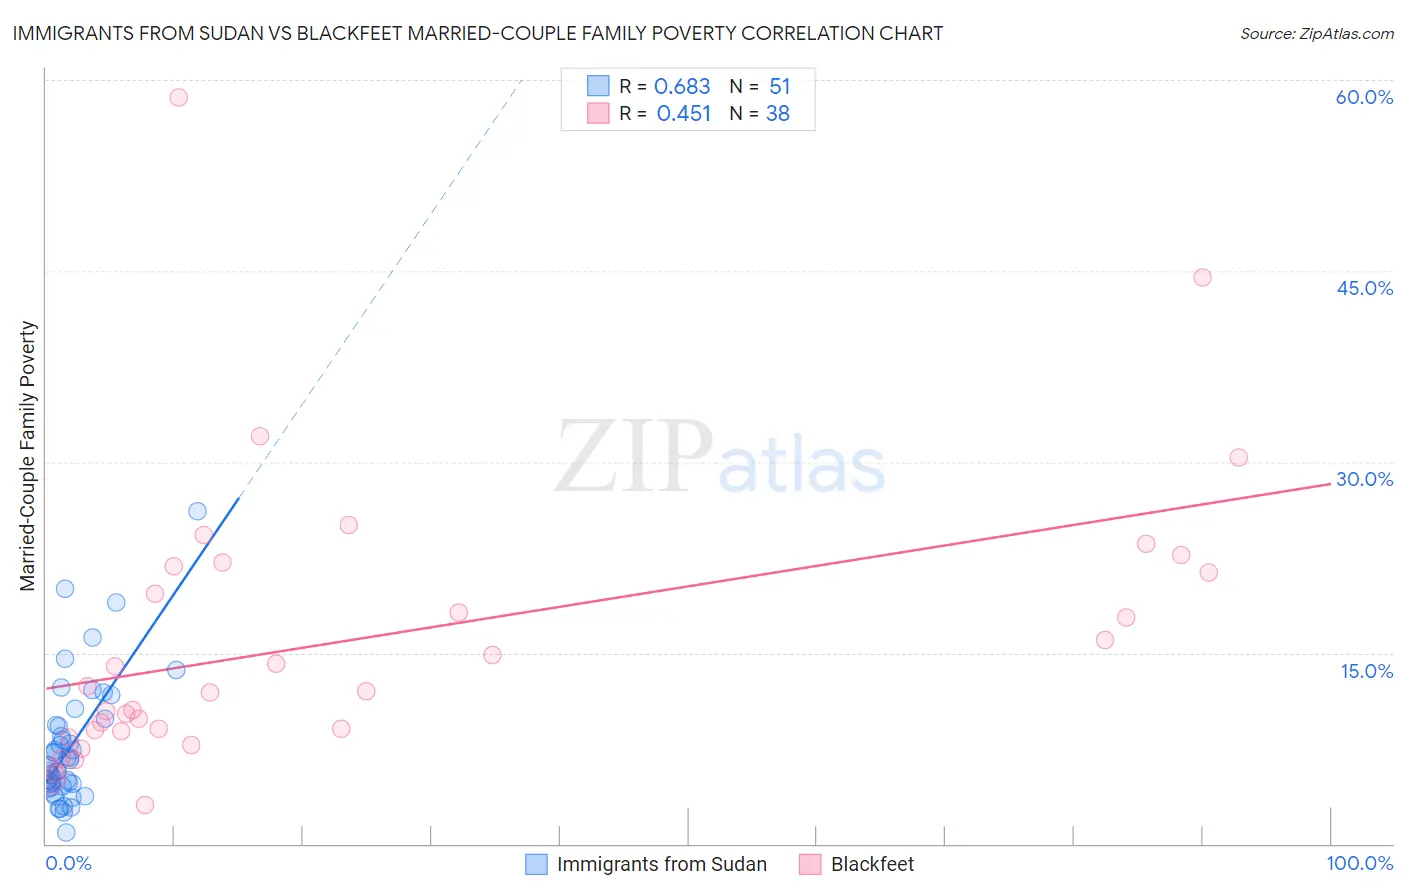
Immigrants from Sudan vs Blackfeet Married-Couple Family Poverty Correlation Chart
The statistical analysis conducted on geographies consisting of 118,776,869 people shows a significant positive correlation between the proportion of Immigrants from Sudan and poverty level among married-couple families in the United States with a correlation coefficient (R) of 0.683 and weighted average of 5.7%. Similarly, the statistical analysis conducted on geographies consisting of 307,833,949 people shows a moderate positive correlation between the proportion of Blackfeet and poverty level among married-couple families in the United States with a correlation coefficient (R) of 0.451 and weighted average of 6.2%, a difference of 7.7%.
Married-Couple Family Poverty Correlation Summary
| Measurement | Immigrants from Sudan | Blackfeet |
| Minimum | 0.91% | 3.1% |
| Maximum | 26.1% | 58.6% |
| Range | 25.2% | 55.5% |
| Mean | 7.6% | 16.2% |
| Median | 6.0% | 12.2% |
| Interquartile 25% (IQ1) | 4.5% | 9.0% |
| Interquartile 75% (IQ3) | 9.3% | 21.8% |
| Interquartile Range (IQR) | 4.9% | 12.8% |
| Standard Deviation (Sample) | 4.9% | 11.2% |
| Standard Deviation (Population) | 4.9% | 11.1% |
Similar Demographics by Married-Couple Family Poverty
Demographics Similar to Immigrants from Sudan by Married-Couple Family Poverty
In terms of married-couple family poverty, the demographic groups most similar to Immigrants from Sudan are Ghanaian (5.7%, a difference of 0.16%), Immigrants from Colombia (5.7%, a difference of 0.19%), Immigrants from Uruguay (5.7%, a difference of 0.19%), Immigrants from South America (5.7%, a difference of 0.32%), and Immigrants from Laos (5.7%, a difference of 0.63%).
| Demographics | Rating | Rank | Married-Couple Family Poverty |
| Arabs | 5.4 /100 | #228 | Tragic 5.7% |
| Sub-Saharan Africans | 4.9 /100 | #229 | Tragic 5.7% |
| Moroccans | 4.9 /100 | #230 | Tragic 5.7% |
| Immigrants | Iraq | 4.4 /100 | #231 | Tragic 5.7% |
| Immigrants | Laos | 4.4 /100 | #232 | Tragic 5.7% |
| Immigrants | Colombia | 3.7 /100 | #233 | Tragic 5.7% |
| Immigrants | Uruguay | 3.7 /100 | #234 | Tragic 5.7% |
| Immigrants | Sudan | 3.5 /100 | #235 | Tragic 5.7% |
| Ghanaians | 3.3 /100 | #236 | Tragic 5.7% |
| Immigrants | South America | 3.1 /100 | #237 | Tragic 5.7% |
| Cherokee | 2.7 /100 | #238 | Tragic 5.8% |
| Venezuelans | 2.7 /100 | #239 | Tragic 5.8% |
| Fijians | 2.5 /100 | #240 | Tragic 5.8% |
| Immigrants | Panama | 2.5 /100 | #241 | Tragic 5.8% |
| Immigrants | Western Africa | 2.4 /100 | #242 | Tragic 5.8% |
Demographics Similar to Blackfeet by Married-Couple Family Poverty
In terms of married-couple family poverty, the demographic groups most similar to Blackfeet are Creek (6.2%, a difference of 0.080%), Spanish American (6.2%, a difference of 0.13%), Immigrants from Congo (6.1%, a difference of 0.43%), Alaska Native (6.2%, a difference of 0.61%), and Immigrants from Senegal (6.1%, a difference of 0.66%).
| Demographics | Rating | Rank | Married-Couple Family Poverty |
| Immigrants | Immigrants | 0.5 /100 | #258 | Tragic 6.0% |
| Alaskan Athabascans | 0.4 /100 | #259 | Tragic 6.1% |
| Jamaicans | 0.3 /100 | #260 | Tragic 6.1% |
| Senegalese | 0.3 /100 | #261 | Tragic 6.1% |
| Shoshone | 0.3 /100 | #262 | Tragic 6.1% |
| Immigrants | Senegal | 0.3 /100 | #263 | Tragic 6.1% |
| Immigrants | Congo | 0.2 /100 | #264 | Tragic 6.1% |
| Blackfeet | 0.2 /100 | #265 | Tragic 6.2% |
| Creek | 0.2 /100 | #266 | Tragic 6.2% |
| Spanish Americans | 0.2 /100 | #267 | Tragic 6.2% |
| Alaska Natives | 0.2 /100 | #268 | Tragic 6.2% |
| Immigrants | West Indies | 0.1 /100 | #269 | Tragic 6.2% |
| Immigrants | Jamaica | 0.1 /100 | #270 | Tragic 6.2% |
| Immigrants | Bahamas | 0.1 /100 | #271 | Tragic 6.2% |
| Trinidadians and Tobagonians | 0.1 /100 | #272 | Tragic 6.2% |