Immigrants from Sudan vs Immigrants from Nepal Married-Couple Family Poverty
COMPARE
Immigrants from Sudan
Immigrants from Nepal
Married-Couple Family Poverty
Married-Couple Family Poverty Comparison
Immigrants from Sudan
Immigrants from Nepal
5.7%
MARRIED-COUPLE FAMILY POVERTY
3.5/ 100
METRIC RATING
235th/ 347
METRIC RANK
4.7%
MARRIED-COUPLE FAMILY POVERTY
95.9/ 100
METRIC RATING
113th/ 347
METRIC RANK
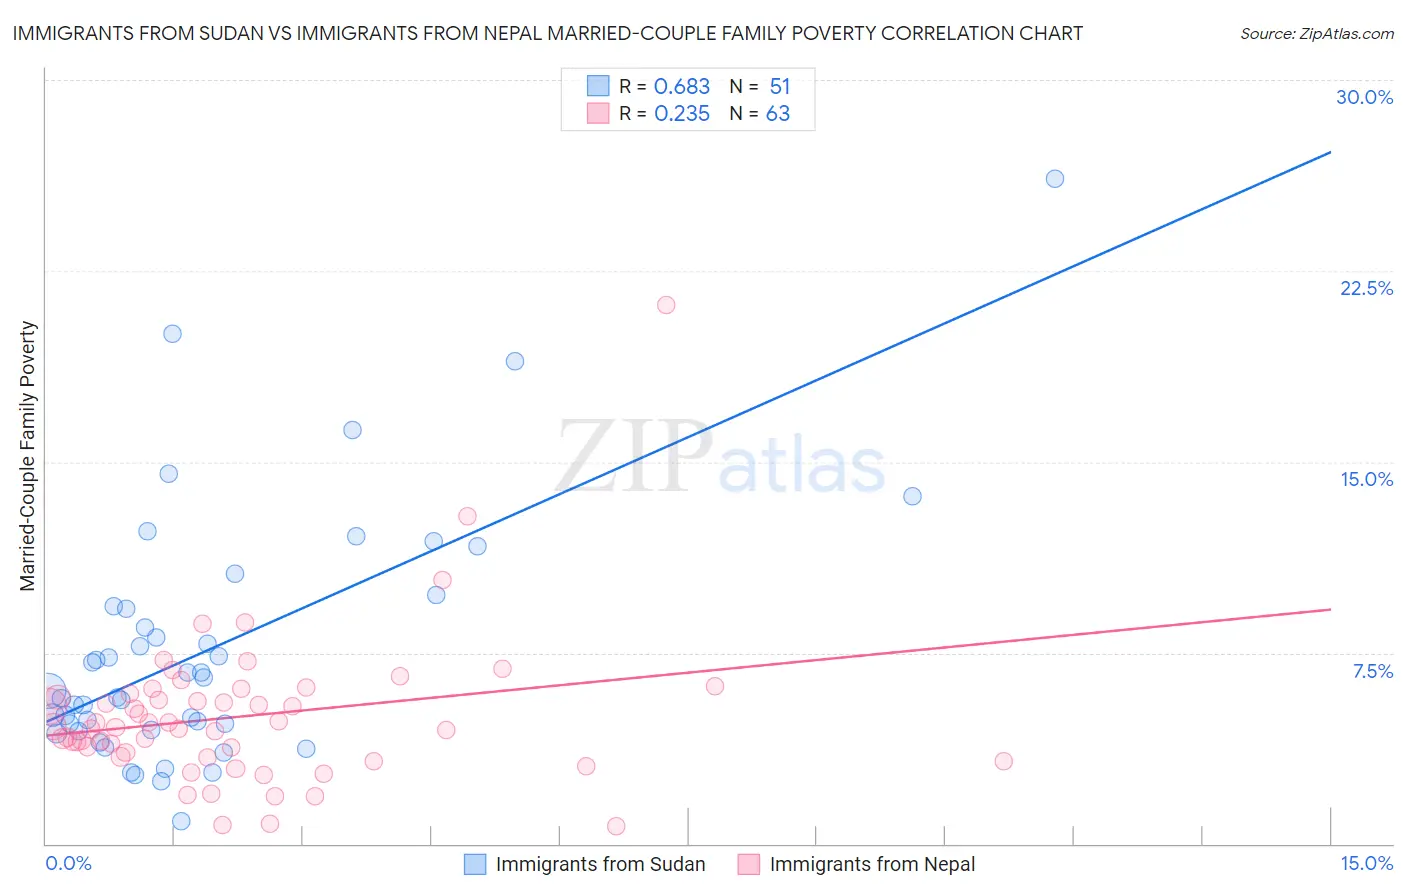
Immigrants from Sudan vs Immigrants from Nepal Married-Couple Family Poverty Correlation Chart
The statistical analysis conducted on geographies consisting of 118,776,869 people shows a significant positive correlation between the proportion of Immigrants from Sudan and poverty level among married-couple families in the United States with a correlation coefficient (R) of 0.683 and weighted average of 5.7%. Similarly, the statistical analysis conducted on geographies consisting of 185,979,517 people shows a weak positive correlation between the proportion of Immigrants from Nepal and poverty level among married-couple families in the United States with a correlation coefficient (R) of 0.235 and weighted average of 4.7%, a difference of 20.7%.
Married-Couple Family Poverty Correlation Summary
| Measurement | Immigrants from Sudan | Immigrants from Nepal |
| Minimum | 0.91% | 0.67% |
| Maximum | 26.1% | 21.1% |
| Range | 25.2% | 20.5% |
| Mean | 7.6% | 5.0% |
| Median | 6.0% | 4.6% |
| Interquartile 25% (IQ1) | 4.5% | 3.4% |
| Interquartile 75% (IQ3) | 9.3% | 5.9% |
| Interquartile Range (IQR) | 4.9% | 2.5% |
| Standard Deviation (Sample) | 4.9% | 3.0% |
| Standard Deviation (Population) | 4.9% | 3.0% |
Similar Demographics by Married-Couple Family Poverty
Demographics Similar to Immigrants from Sudan by Married-Couple Family Poverty
In terms of married-couple family poverty, the demographic groups most similar to Immigrants from Sudan are Ghanaian (5.7%, a difference of 0.16%), Immigrants from Colombia (5.7%, a difference of 0.19%), Immigrants from Uruguay (5.7%, a difference of 0.19%), Immigrants from South America (5.7%, a difference of 0.32%), and Immigrants from Laos (5.7%, a difference of 0.63%).
| Demographics | Rating | Rank | Married-Couple Family Poverty |
| Arabs | 5.4 /100 | #228 | Tragic 5.7% |
| Sub-Saharan Africans | 4.9 /100 | #229 | Tragic 5.7% |
| Moroccans | 4.9 /100 | #230 | Tragic 5.7% |
| Immigrants | Iraq | 4.4 /100 | #231 | Tragic 5.7% |
| Immigrants | Laos | 4.4 /100 | #232 | Tragic 5.7% |
| Immigrants | Colombia | 3.7 /100 | #233 | Tragic 5.7% |
| Immigrants | Uruguay | 3.7 /100 | #234 | Tragic 5.7% |
| Immigrants | Sudan | 3.5 /100 | #235 | Tragic 5.7% |
| Ghanaians | 3.3 /100 | #236 | Tragic 5.7% |
| Immigrants | South America | 3.1 /100 | #237 | Tragic 5.7% |
| Cherokee | 2.7 /100 | #238 | Tragic 5.8% |
| Venezuelans | 2.7 /100 | #239 | Tragic 5.8% |
| Fijians | 2.5 /100 | #240 | Tragic 5.8% |
| Immigrants | Panama | 2.5 /100 | #241 | Tragic 5.8% |
| Immigrants | Western Africa | 2.4 /100 | #242 | Tragic 5.8% |
Demographics Similar to Immigrants from Nepal by Married-Couple Family Poverty
In terms of married-couple family poverty, the demographic groups most similar to Immigrants from Nepal are Tongan (4.7%, a difference of 0.070%), Pakistani (4.7%, a difference of 0.25%), Immigrants from Bolivia (4.7%, a difference of 0.29%), Immigrants from Hong Kong (4.7%, a difference of 0.45%), and Immigrants from Indonesia (4.8%, a difference of 0.58%).
| Demographics | Rating | Rank | Married-Couple Family Poverty |
| Immigrants | France | 96.9 /100 | #106 | Exceptional 4.7% |
| Immigrants | Germany | 96.8 /100 | #107 | Exceptional 4.7% |
| Laotians | 96.6 /100 | #108 | Exceptional 4.7% |
| Immigrants | Hong Kong | 96.4 /100 | #109 | Exceptional 4.7% |
| Immigrants | Bolivia | 96.2 /100 | #110 | Exceptional 4.7% |
| Pakistanis | 96.2 /100 | #111 | Exceptional 4.7% |
| Tongans | 95.9 /100 | #112 | Exceptional 4.7% |
| Immigrants | Nepal | 95.9 /100 | #113 | Exceptional 4.7% |
| Immigrants | Indonesia | 95.1 /100 | #114 | Exceptional 4.8% |
| Taiwanese | 94.8 /100 | #115 | Exceptional 4.8% |
| Celtics | 94.8 /100 | #116 | Exceptional 4.8% |
| Kenyans | 94.7 /100 | #117 | Exceptional 4.8% |
| Immigrants | Philippines | 94.6 /100 | #118 | Exceptional 4.8% |
| Immigrants | Eastern Asia | 94.0 /100 | #119 | Exceptional 4.8% |
| Immigrants | Southern Europe | 93.4 /100 | #120 | Exceptional 4.8% |