Immigrants from Sudan vs Blackfeet Male Disability
COMPARE
Immigrants from Sudan
Blackfeet
Male Disability
Male Disability Comparison
Immigrants from Sudan
Blackfeet
11.0%
MALE DISABILITY
81.5/ 100
METRIC RATING
142nd/ 347
METRIC RANK
13.4%
MALE DISABILITY
0.0/ 100
METRIC RATING
309th/ 347
METRIC RANK
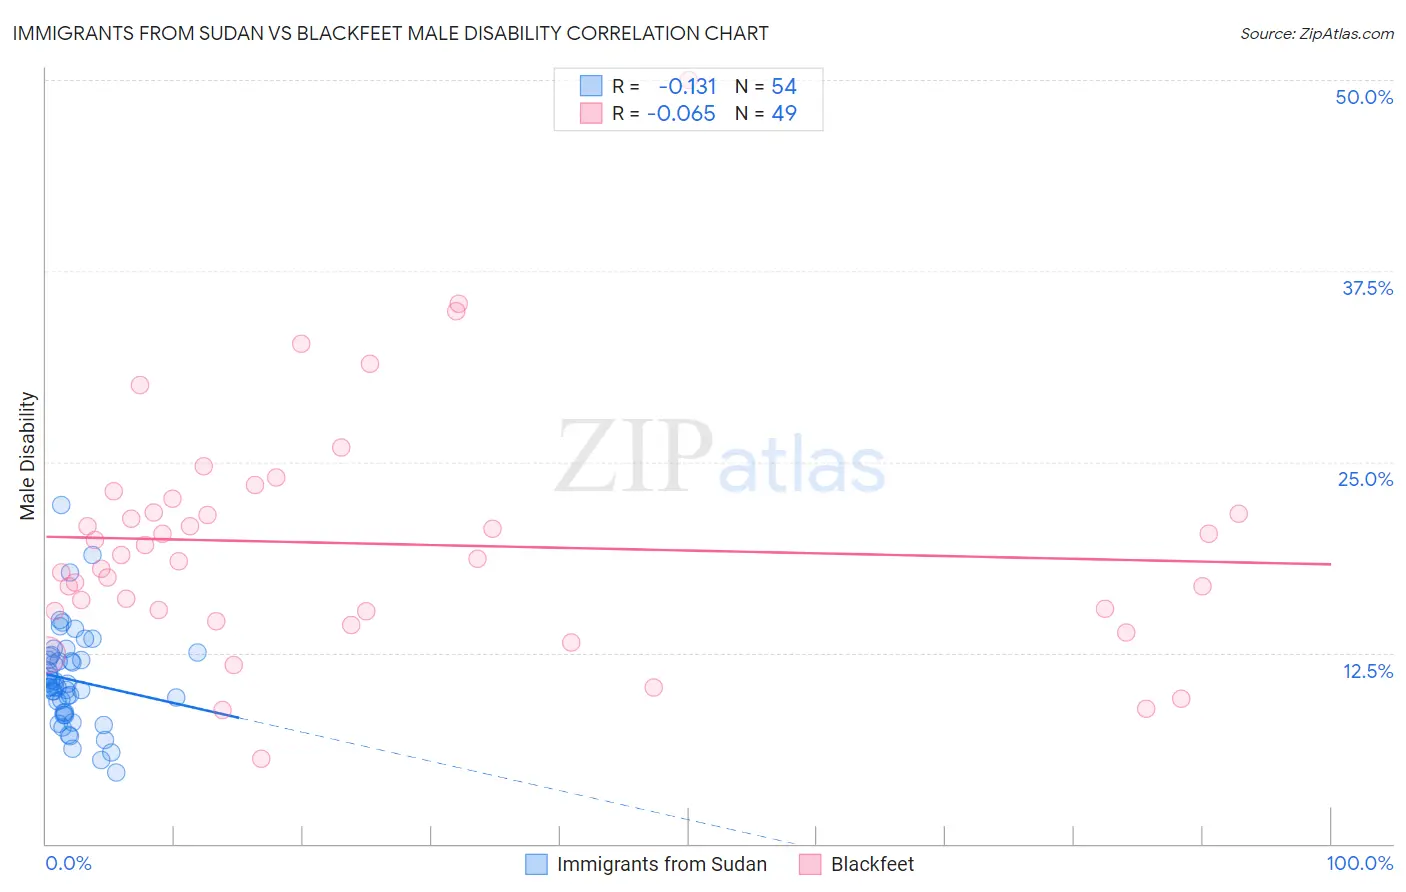
Immigrants from Sudan vs Blackfeet Male Disability Correlation Chart
The statistical analysis conducted on geographies consisting of 118,961,882 people shows a poor negative correlation between the proportion of Immigrants from Sudan and percentage of males with a disability in the United States with a correlation coefficient (R) of -0.131 and weighted average of 11.0%. Similarly, the statistical analysis conducted on geographies consisting of 309,505,092 people shows a slight negative correlation between the proportion of Blackfeet and percentage of males with a disability in the United States with a correlation coefficient (R) of -0.065 and weighted average of 13.4%, a difference of 22.1%.
Male Disability Correlation Summary
| Measurement | Immigrants from Sudan | Blackfeet |
| Minimum | 4.7% | 5.6% |
| Maximum | 22.1% | 50.0% |
| Range | 17.5% | 44.4% |
| Mean | 10.7% | 19.6% |
| Median | 10.2% | 18.6% |
| Interquartile 25% (IQ1) | 8.6% | 15.2% |
| Interquartile 75% (IQ3) | 12.3% | 22.2% |
| Interquartile Range (IQR) | 3.7% | 6.9% |
| Standard Deviation (Sample) | 3.2% | 7.9% |
| Standard Deviation (Population) | 3.2% | 7.8% |
Similar Demographics by Male Disability
Demographics Similar to Immigrants from Sudan by Male Disability
In terms of male disability, the demographic groups most similar to Immigrants from Sudan are Immigrants from Italy (11.0%, a difference of 0.0%), Arab (11.0%, a difference of 0.0%), South African (11.0%, a difference of 0.020%), Nigerian (11.0%, a difference of 0.040%), and Immigrants from Europe (11.0%, a difference of 0.050%).
| Demographics | Rating | Rank | Male Disability |
| Trinidadians and Tobagonians | 83.3 /100 | #135 | Excellent 11.0% |
| Immigrants | Costa Rica | 82.8 /100 | #136 | Excellent 11.0% |
| Immigrants | Europe | 82.0 /100 | #137 | Excellent 11.0% |
| Nigerians | 81.9 /100 | #138 | Excellent 11.0% |
| South Africans | 81.7 /100 | #139 | Excellent 11.0% |
| Immigrants | Italy | 81.5 /100 | #140 | Excellent 11.0% |
| Arabs | 81.5 /100 | #141 | Excellent 11.0% |
| Immigrants | Sudan | 81.5 /100 | #142 | Excellent 11.0% |
| Moroccans | 80.7 /100 | #143 | Excellent 11.0% |
| Kenyans | 78.1 /100 | #144 | Good 11.0% |
| Costa Ricans | 78.0 /100 | #145 | Good 11.0% |
| Koreans | 77.5 /100 | #146 | Good 11.0% |
| Immigrants | Croatia | 77.3 /100 | #147 | Good 11.0% |
| Sudanese | 77.1 /100 | #148 | Good 11.0% |
| Immigrants | Denmark | 76.4 /100 | #149 | Good 11.0% |
Demographics Similar to Blackfeet by Male Disability
In terms of male disability, the demographic groups most similar to Blackfeet are Immigrants from the Azores (13.4%, a difference of 0.14%), Delaware (13.5%, a difference of 0.33%), French American Indian (13.4%, a difference of 0.42%), Arapaho (13.3%, a difference of 0.58%), and Spanish American (13.3%, a difference of 0.80%).
| Demographics | Rating | Rank | Male Disability |
| Crow | 0.0 /100 | #302 | Tragic 13.1% |
| Scotch-Irish | 0.0 /100 | #303 | Tragic 13.2% |
| Blacks/African Americans | 0.0 /100 | #304 | Tragic 13.2% |
| French Canadians | 0.0 /100 | #305 | Tragic 13.3% |
| Spanish Americans | 0.0 /100 | #306 | Tragic 13.3% |
| Arapaho | 0.0 /100 | #307 | Tragic 13.3% |
| French American Indians | 0.0 /100 | #308 | Tragic 13.4% |
| Blackfeet | 0.0 /100 | #309 | Tragic 13.4% |
| Immigrants | Azores | 0.0 /100 | #310 | Tragic 13.4% |
| Delaware | 0.0 /100 | #311 | Tragic 13.5% |
| Yakama | 0.0 /100 | #312 | Tragic 13.5% |
| Puget Sound Salish | 0.0 /100 | #313 | Tragic 13.5% |
| Aleuts | 0.0 /100 | #314 | Tragic 13.5% |
| Iroquois | 0.0 /100 | #315 | Tragic 13.6% |
| Alaska Natives | 0.0 /100 | #316 | Tragic 13.6% |