Immigrants from Sudan vs Afghan Married-Couple Family Poverty
COMPARE
Immigrants from Sudan
Afghan
Married-Couple Family Poverty
Married-Couple Family Poverty Comparison
Immigrants from Sudan
Afghans
5.7%
MARRIED-COUPLE FAMILY POVERTY
3.5/ 100
METRIC RATING
235th/ 347
METRIC RANK
5.5%
MARRIED-COUPLE FAMILY POVERTY
11.2/ 100
METRIC RATING
218th/ 347
METRIC RANK
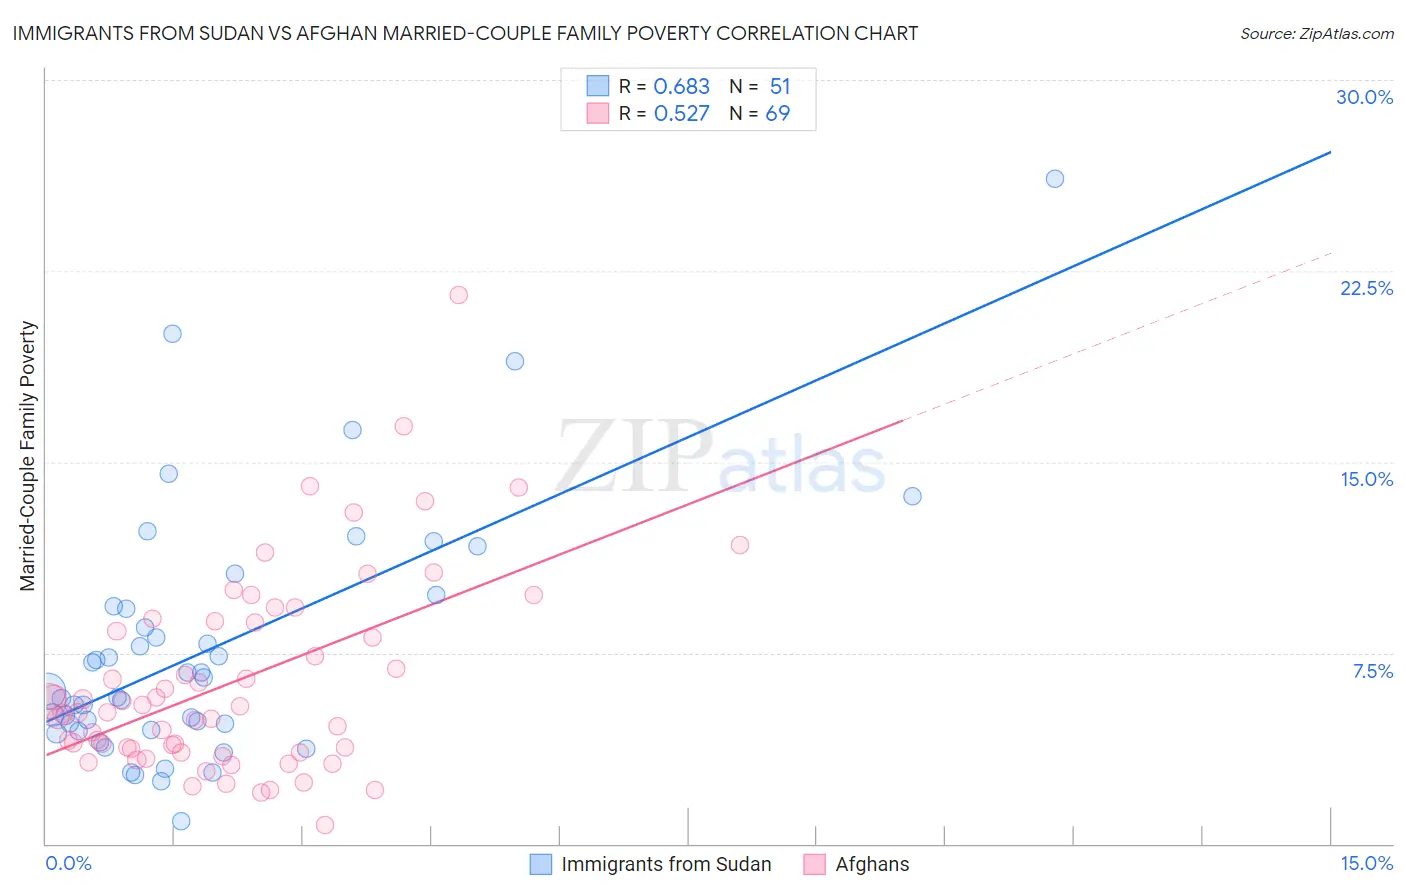
Immigrants from Sudan vs Afghan Married-Couple Family Poverty Correlation Chart
The statistical analysis conducted on geographies consisting of 118,776,869 people shows a significant positive correlation between the proportion of Immigrants from Sudan and poverty level among married-couple families in the United States with a correlation coefficient (R) of 0.683 and weighted average of 5.7%. Similarly, the statistical analysis conducted on geographies consisting of 148,344,373 people shows a substantial positive correlation between the proportion of Afghans and poverty level among married-couple families in the United States with a correlation coefficient (R) of 0.527 and weighted average of 5.5%, a difference of 3.4%.
Married-Couple Family Poverty Correlation Summary
| Measurement | Immigrants from Sudan | Afghan |
| Minimum | 0.91% | 0.76% |
| Maximum | 26.1% | 21.6% |
| Range | 25.2% | 20.8% |
| Mean | 7.6% | 6.4% |
| Median | 6.0% | 5.2% |
| Interquartile 25% (IQ1) | 4.5% | 3.7% |
| Interquartile 75% (IQ3) | 9.3% | 8.7% |
| Interquartile Range (IQR) | 4.9% | 5.1% |
| Standard Deviation (Sample) | 4.9% | 3.9% |
| Standard Deviation (Population) | 4.9% | 3.9% |
Demographics Similar to Immigrants from Sudan and Afghans by Married-Couple Family Poverty
In terms of married-couple family poverty, the demographic groups most similar to Immigrants from Sudan are Ghanaian (5.7%, a difference of 0.16%), Immigrants from Colombia (5.7%, a difference of 0.19%), Immigrants from Uruguay (5.7%, a difference of 0.19%), Immigrants from Laos (5.7%, a difference of 0.63%), and Immigrants from Iraq (5.7%, a difference of 0.69%). Similarly, the demographic groups most similar to Afghans are Immigrants from Nigeria (5.5%, a difference of 0.020%), Potawatomi (5.5%, a difference of 0.31%), Japanese (5.6%, a difference of 0.40%), Colombian (5.6%, a difference of 0.59%), and Panamanian (5.6%, a difference of 0.61%).
| Demographics | Rating | Rank | Married-Couple Family Poverty |
| Potawatomi | 12.4 /100 | #216 | Poor 5.5% |
| Immigrants | Nigeria | 11.3 /100 | #217 | Poor 5.5% |
| Afghans | 11.2 /100 | #218 | Poor 5.5% |
| Japanese | 9.8 /100 | #219 | Tragic 5.6% |
| Colombians | 9.2 /100 | #220 | Tragic 5.6% |
| Panamanians | 9.2 /100 | #221 | Tragic 5.6% |
| Cajuns | 6.9 /100 | #222 | Tragic 5.6% |
| Immigrants | Fiji | 6.7 /100 | #223 | Tragic 5.6% |
| Sudanese | 6.4 /100 | #224 | Tragic 5.6% |
| Immigrants | Cambodia | 6.1 /100 | #225 | Tragic 5.6% |
| South Americans | 5.7 /100 | #226 | Tragic 5.6% |
| Immigrants | Zaire | 5.6 /100 | #227 | Tragic 5.6% |
| Arabs | 5.4 /100 | #228 | Tragic 5.7% |
| Sub-Saharan Africans | 4.9 /100 | #229 | Tragic 5.7% |
| Moroccans | 4.9 /100 | #230 | Tragic 5.7% |
| Immigrants | Iraq | 4.4 /100 | #231 | Tragic 5.7% |
| Immigrants | Laos | 4.4 /100 | #232 | Tragic 5.7% |
| Immigrants | Colombia | 3.7 /100 | #233 | Tragic 5.7% |
| Immigrants | Uruguay | 3.7 /100 | #234 | Tragic 5.7% |
| Immigrants | Sudan | 3.5 /100 | #235 | Tragic 5.7% |
| Ghanaians | 3.3 /100 | #236 | Tragic 5.7% |