Immigrants from Sudan vs Cypriot Married-Couple Family Poverty
COMPARE
Immigrants from Sudan
Cypriot
Married-Couple Family Poverty
Married-Couple Family Poverty Comparison
Immigrants from Sudan
Cypriots
5.7%
MARRIED-COUPLE FAMILY POVERTY
3.5/ 100
METRIC RATING
235th/ 347
METRIC RANK
4.1%
MARRIED-COUPLE FAMILY POVERTY
99.9/ 100
METRIC RATING
26th/ 347
METRIC RANK
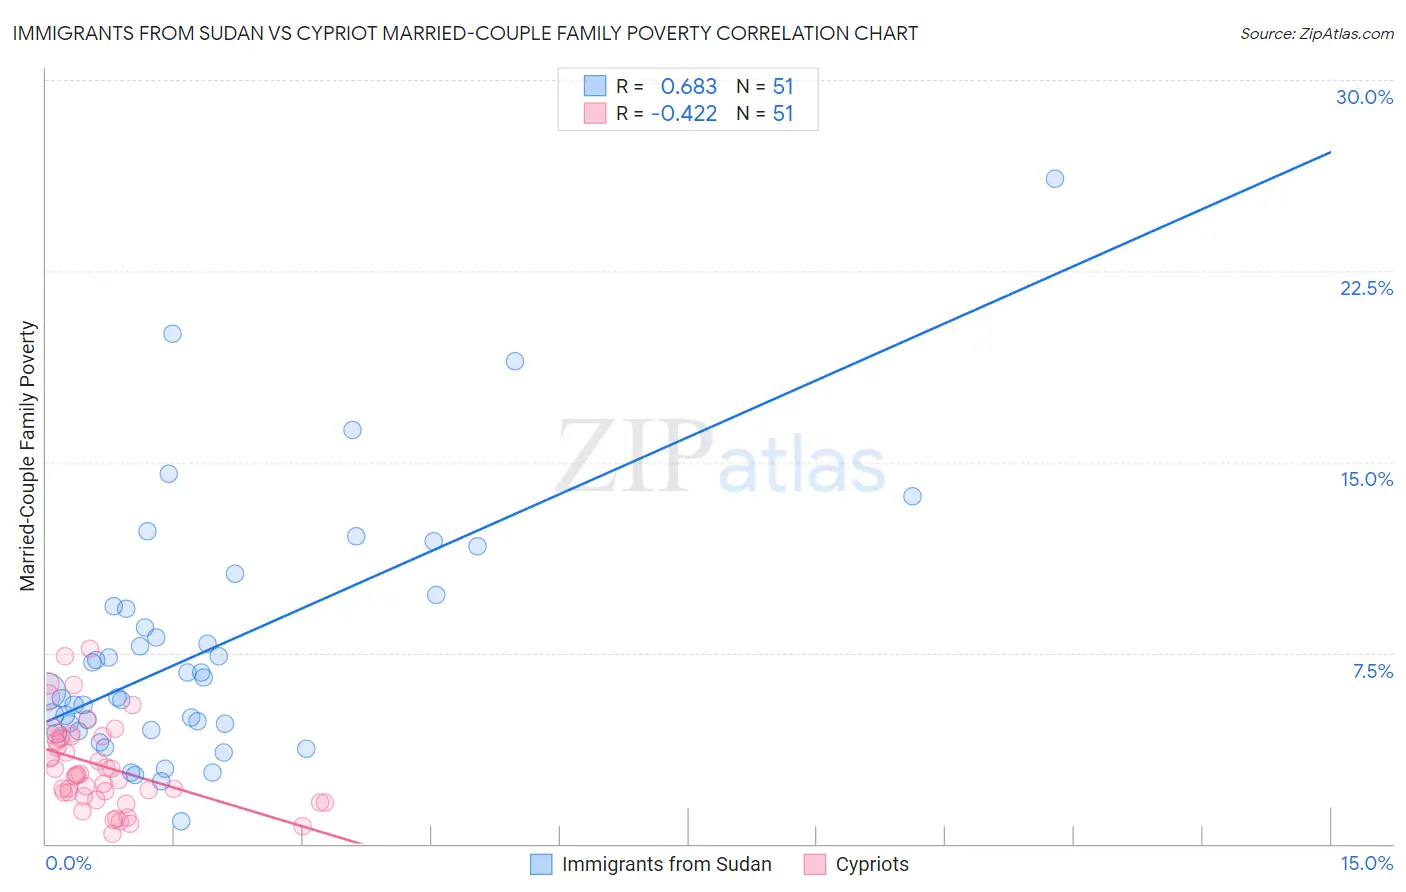
Immigrants from Sudan vs Cypriot Married-Couple Family Poverty Correlation Chart
The statistical analysis conducted on geographies consisting of 118,776,869 people shows a significant positive correlation between the proportion of Immigrants from Sudan and poverty level among married-couple families in the United States with a correlation coefficient (R) of 0.683 and weighted average of 5.7%. Similarly, the statistical analysis conducted on geographies consisting of 61,691,047 people shows a moderate negative correlation between the proportion of Cypriots and poverty level among married-couple families in the United States with a correlation coefficient (R) of -0.422 and weighted average of 4.1%, a difference of 38.2%.
Married-Couple Family Poverty Correlation Summary
| Measurement | Immigrants from Sudan | Cypriot |
| Minimum | 0.91% | 0.39% |
| Maximum | 26.1% | 7.7% |
| Range | 25.2% | 7.3% |
| Mean | 7.6% | 3.1% |
| Median | 6.0% | 2.7% |
| Interquartile 25% (IQ1) | 4.5% | 1.9% |
| Interquartile 75% (IQ3) | 9.3% | 4.2% |
| Interquartile Range (IQR) | 4.9% | 2.4% |
| Standard Deviation (Sample) | 4.9% | 1.7% |
| Standard Deviation (Population) | 4.9% | 1.7% |
Similar Demographics by Married-Couple Family Poverty
Demographics Similar to Immigrants from Sudan by Married-Couple Family Poverty
In terms of married-couple family poverty, the demographic groups most similar to Immigrants from Sudan are Ghanaian (5.7%, a difference of 0.16%), Immigrants from Colombia (5.7%, a difference of 0.19%), Immigrants from Uruguay (5.7%, a difference of 0.19%), Immigrants from South America (5.7%, a difference of 0.32%), and Immigrants from Laos (5.7%, a difference of 0.63%).
| Demographics | Rating | Rank | Married-Couple Family Poverty |
| Arabs | 5.4 /100 | #228 | Tragic 5.7% |
| Sub-Saharan Africans | 4.9 /100 | #229 | Tragic 5.7% |
| Moroccans | 4.9 /100 | #230 | Tragic 5.7% |
| Immigrants | Iraq | 4.4 /100 | #231 | Tragic 5.7% |
| Immigrants | Laos | 4.4 /100 | #232 | Tragic 5.7% |
| Immigrants | Colombia | 3.7 /100 | #233 | Tragic 5.7% |
| Immigrants | Uruguay | 3.7 /100 | #234 | Tragic 5.7% |
| Immigrants | Sudan | 3.5 /100 | #235 | Tragic 5.7% |
| Ghanaians | 3.3 /100 | #236 | Tragic 5.7% |
| Immigrants | South America | 3.1 /100 | #237 | Tragic 5.7% |
| Cherokee | 2.7 /100 | #238 | Tragic 5.8% |
| Venezuelans | 2.7 /100 | #239 | Tragic 5.8% |
| Fijians | 2.5 /100 | #240 | Tragic 5.8% |
| Immigrants | Panama | 2.5 /100 | #241 | Tragic 5.8% |
| Immigrants | Western Africa | 2.4 /100 | #242 | Tragic 5.8% |
Demographics Similar to Cypriots by Married-Couple Family Poverty
In terms of married-couple family poverty, the demographic groups most similar to Cypriots are Danish (4.1%, a difference of 0.11%), Scandinavian (4.1%, a difference of 0.22%), Immigrants from Scotland (4.2%, a difference of 0.26%), Immigrants from Taiwan (4.1%, a difference of 0.27%), and Finnish (4.2%, a difference of 0.50%).
| Demographics | Rating | Rank | Married-Couple Family Poverty |
| Immigrants | Ireland | 99.9 /100 | #19 | Exceptional 4.1% |
| Maltese | 99.9 /100 | #20 | Exceptional 4.1% |
| Zimbabweans | 99.9 /100 | #21 | Exceptional 4.1% |
| Immigrants | Singapore | 99.9 /100 | #22 | Exceptional 4.1% |
| Bhutanese | 99.9 /100 | #23 | Exceptional 4.1% |
| Eastern Europeans | 99.9 /100 | #24 | Exceptional 4.1% |
| Immigrants | Taiwan | 99.9 /100 | #25 | Exceptional 4.1% |
| Cypriots | 99.9 /100 | #26 | Exceptional 4.1% |
| Danes | 99.9 /100 | #27 | Exceptional 4.1% |
| Scandinavians | 99.9 /100 | #28 | Exceptional 4.1% |
| Immigrants | Scotland | 99.9 /100 | #29 | Exceptional 4.2% |
| Finns | 99.9 /100 | #30 | Exceptional 4.2% |
| Estonians | 99.9 /100 | #31 | Exceptional 4.2% |
| Greeks | 99.9 /100 | #32 | Exceptional 4.2% |
| Irish | 99.9 /100 | #33 | Exceptional 4.2% |