Immigrants from St. Vincent and the Grenadines vs Puerto Rican Married-Couple Family Poverty
COMPARE
Immigrants from St. Vincent and the Grenadines
Puerto Rican
Married-Couple Family Poverty
Married-Couple Family Poverty Comparison
Immigrants from St. Vincent and the Grenadines
Puerto Ricans
7.1%
MARRIED-COUPLE FAMILY POVERTY
0.0/ 100
METRIC RATING
313th/ 347
METRIC RANK
12.6%
MARRIED-COUPLE FAMILY POVERTY
0.0/ 100
METRIC RATING
345th/ 347
METRIC RANK
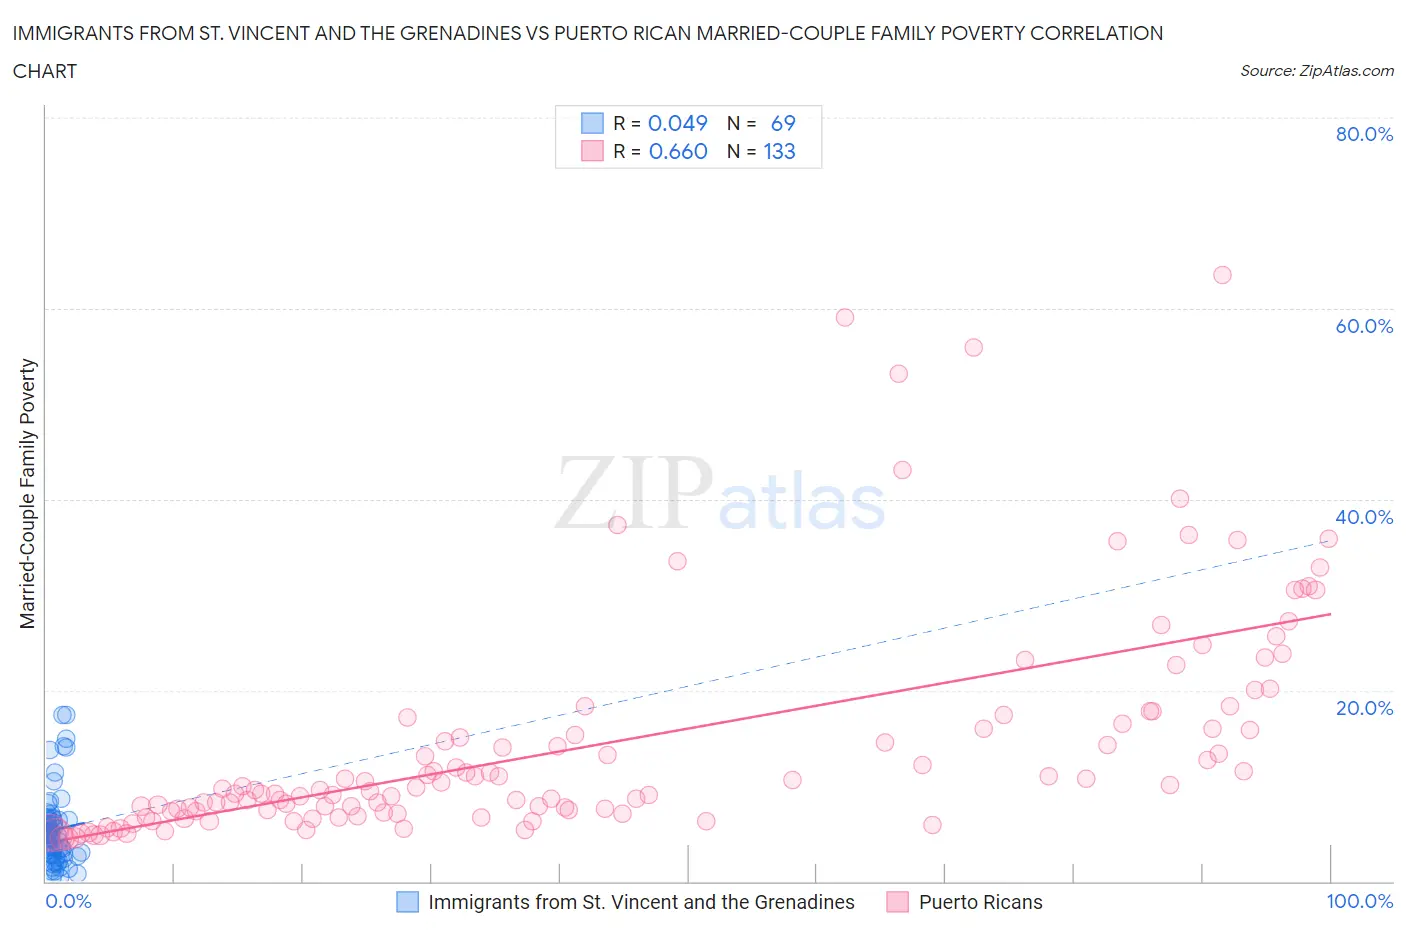
Immigrants from St. Vincent and the Grenadines vs Puerto Rican Married-Couple Family Poverty Correlation Chart
The statistical analysis conducted on geographies consisting of 56,063,959 people shows no correlation between the proportion of Immigrants from St. Vincent and the Grenadines and poverty level among married-couple families in the United States with a correlation coefficient (R) of 0.049 and weighted average of 7.1%. Similarly, the statistical analysis conducted on geographies consisting of 519,143,813 people shows a significant positive correlation between the proportion of Puerto Ricans and poverty level among married-couple families in the United States with a correlation coefficient (R) of 0.660 and weighted average of 12.6%, a difference of 77.8%.
Married-Couple Family Poverty Correlation Summary
| Measurement | Immigrants from St. Vincent and the Grenadines | Puerto Rican |
| Minimum | 0.34% | 4.4% |
| Maximum | 17.4% | 63.5% |
| Range | 17.1% | 59.1% |
| Mean | 5.4% | 14.4% |
| Median | 4.9% | 9.7% |
| Interquartile 25% (IQ1) | 2.8% | 7.2% |
| Interquartile 75% (IQ3) | 6.5% | 16.9% |
| Interquartile Range (IQR) | 3.7% | 9.6% |
| Standard Deviation (Sample) | 3.8% | 11.7% |
| Standard Deviation (Population) | 3.8% | 11.7% |
Similar Demographics by Married-Couple Family Poverty
Demographics Similar to Immigrants from St. Vincent and the Grenadines by Married-Couple Family Poverty
In terms of married-couple family poverty, the demographic groups most similar to Immigrants from St. Vincent and the Grenadines are Immigrants from Dominica (7.1%, a difference of 0.11%), Immigrants from Armenia (7.1%, a difference of 0.11%), Immigrants from Nicaragua (7.1%, a difference of 0.17%), Hopi (7.1%, a difference of 0.19%), and British West Indian (7.1%, a difference of 0.30%).
| Demographics | Rating | Rank | Married-Couple Family Poverty |
| Immigrants | Haiti | 0.0 /100 | #306 | Tragic 7.0% |
| Guatemalans | 0.0 /100 | #307 | Tragic 7.0% |
| Spanish American Indians | 0.0 /100 | #308 | Tragic 7.1% |
| Hopi | 0.0 /100 | #309 | Tragic 7.1% |
| Immigrants | Nicaragua | 0.0 /100 | #310 | Tragic 7.1% |
| Immigrants | Dominica | 0.0 /100 | #311 | Tragic 7.1% |
| Immigrants | Armenia | 0.0 /100 | #312 | Tragic 7.1% |
| Immigrants | St. Vincent and the Grenadines | 0.0 /100 | #313 | Tragic 7.1% |
| British West Indians | 0.0 /100 | #314 | Tragic 7.1% |
| Inupiat | 0.0 /100 | #315 | Tragic 7.1% |
| Hondurans | 0.0 /100 | #316 | Tragic 7.2% |
| Mexicans | 0.0 /100 | #317 | Tragic 7.2% |
| Immigrants | Guatemala | 0.0 /100 | #318 | Tragic 7.2% |
| Immigrants | Latin America | 0.0 /100 | #319 | Tragic 7.2% |
| Immigrants | Grenada | 0.0 /100 | #320 | Tragic 7.3% |
Demographics Similar to Puerto Ricans by Married-Couple Family Poverty
In terms of married-couple family poverty, the demographic groups most similar to Puerto Ricans are Immigrants from Yemen (12.8%, a difference of 1.3%), Yup'ik (13.4%, a difference of 6.0%), Navajo (11.9%, a difference of 6.6%), Pima (11.4%, a difference of 10.8%), and Tohono O'odham (11.2%, a difference of 12.6%).
| Demographics | Rating | Rank | Married-Couple Family Poverty |
| Lumbee | 0.0 /100 | #333 | Tragic 8.3% |
| Immigrants | Dominican Republic | 0.0 /100 | #334 | Tragic 8.4% |
| Sioux | 0.0 /100 | #335 | Tragic 8.7% |
| Apache | 0.0 /100 | #336 | Tragic 9.0% |
| Yakama | 0.0 /100 | #337 | Tragic 9.0% |
| Cheyenne | 0.0 /100 | #338 | Tragic 9.4% |
| Crow | 0.0 /100 | #339 | Tragic 9.6% |
| Yuman | 0.0 /100 | #340 | Tragic 9.7% |
| Pueblo | 0.0 /100 | #341 | Tragic 11.1% |
| Tohono O'odham | 0.0 /100 | #342 | Tragic 11.2% |
| Pima | 0.0 /100 | #343 | Tragic 11.4% |
| Navajo | 0.0 /100 | #344 | Tragic 11.9% |
| Puerto Ricans | 0.0 /100 | #345 | Tragic 12.6% |
| Immigrants | Yemen | 0.0 /100 | #346 | Tragic 12.8% |
| Yup'ik | 0.0 /100 | #347 | Tragic 13.4% |