Immigrants from St. Vincent and the Grenadines vs Marshallese Married-Couple Family Poverty
COMPARE
Immigrants from St. Vincent and the Grenadines
Marshallese
Married-Couple Family Poverty
Married-Couple Family Poverty Comparison
Immigrants from St. Vincent and the Grenadines
Marshallese
7.1%
MARRIED-COUPLE FAMILY POVERTY
0.0/ 100
METRIC RATING
313th/ 347
METRIC RANK
5.2%
MARRIED-COUPLE FAMILY POVERTY
47.9/ 100
METRIC RATING
175th/ 347
METRIC RANK
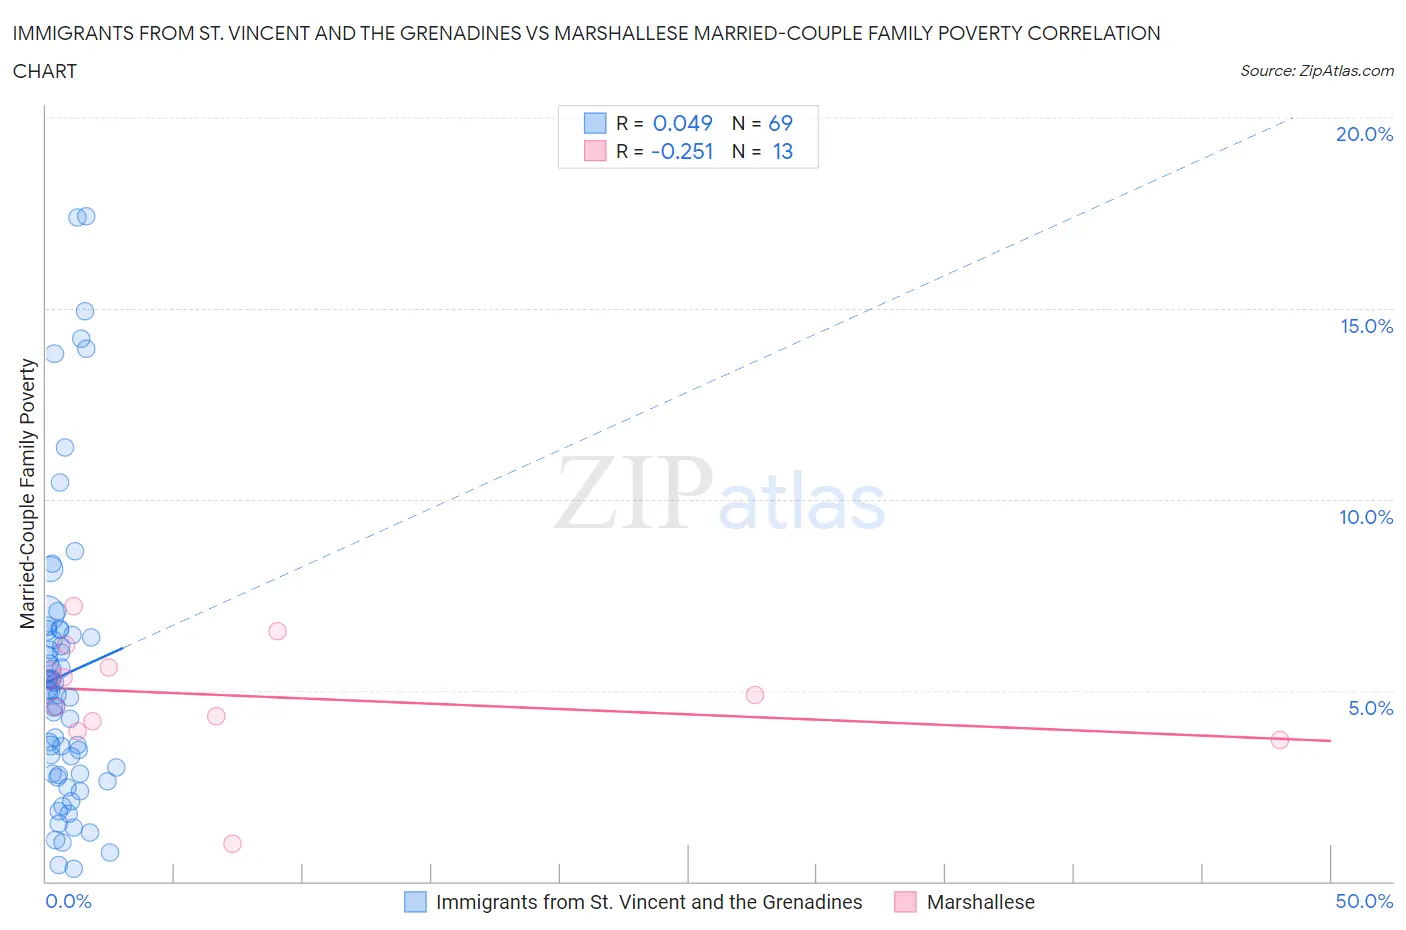
Immigrants from St. Vincent and the Grenadines vs Marshallese Married-Couple Family Poverty Correlation Chart
The statistical analysis conducted on geographies consisting of 56,063,959 people shows no correlation between the proportion of Immigrants from St. Vincent and the Grenadines and poverty level among married-couple families in the United States with a correlation coefficient (R) of 0.049 and weighted average of 7.1%. Similarly, the statistical analysis conducted on geographies consisting of 14,723,885 people shows a weak negative correlation between the proportion of Marshallese and poverty level among married-couple families in the United States with a correlation coefficient (R) of -0.251 and weighted average of 5.2%, a difference of 35.8%.
Married-Couple Family Poverty Correlation Summary
| Measurement | Immigrants from St. Vincent and the Grenadines | Marshallese |
| Minimum | 0.34% | 1.00% |
| Maximum | 17.4% | 7.2% |
| Range | 17.1% | 6.2% |
| Mean | 5.4% | 4.8% |
| Median | 4.9% | 4.9% |
| Interquartile 25% (IQ1) | 2.8% | 4.1% |
| Interquartile 75% (IQ3) | 6.5% | 5.9% |
| Interquartile Range (IQR) | 3.7% | 1.8% |
| Standard Deviation (Sample) | 3.8% | 1.6% |
| Standard Deviation (Population) | 3.8% | 1.5% |
Similar Demographics by Married-Couple Family Poverty
Demographics Similar to Immigrants from St. Vincent and the Grenadines by Married-Couple Family Poverty
In terms of married-couple family poverty, the demographic groups most similar to Immigrants from St. Vincent and the Grenadines are Immigrants from Dominica (7.1%, a difference of 0.11%), Immigrants from Armenia (7.1%, a difference of 0.11%), Immigrants from Nicaragua (7.1%, a difference of 0.17%), Hopi (7.1%, a difference of 0.19%), and British West Indian (7.1%, a difference of 0.30%).
| Demographics | Rating | Rank | Married-Couple Family Poverty |
| Immigrants | Haiti | 0.0 /100 | #306 | Tragic 7.0% |
| Guatemalans | 0.0 /100 | #307 | Tragic 7.0% |
| Spanish American Indians | 0.0 /100 | #308 | Tragic 7.1% |
| Hopi | 0.0 /100 | #309 | Tragic 7.1% |
| Immigrants | Nicaragua | 0.0 /100 | #310 | Tragic 7.1% |
| Immigrants | Dominica | 0.0 /100 | #311 | Tragic 7.1% |
| Immigrants | Armenia | 0.0 /100 | #312 | Tragic 7.1% |
| Immigrants | St. Vincent and the Grenadines | 0.0 /100 | #313 | Tragic 7.1% |
| British West Indians | 0.0 /100 | #314 | Tragic 7.1% |
| Inupiat | 0.0 /100 | #315 | Tragic 7.1% |
| Hondurans | 0.0 /100 | #316 | Tragic 7.2% |
| Mexicans | 0.0 /100 | #317 | Tragic 7.2% |
| Immigrants | Guatemala | 0.0 /100 | #318 | Tragic 7.2% |
| Immigrants | Latin America | 0.0 /100 | #319 | Tragic 7.2% |
| Immigrants | Grenada | 0.0 /100 | #320 | Tragic 7.3% |
Demographics Similar to Marshallese by Married-Couple Family Poverty
In terms of married-couple family poverty, the demographic groups most similar to Marshallese are Menominee (5.2%, a difference of 0.010%), Immigrants from Eastern Africa (5.2%, a difference of 0.24%), Immigrants from Kazakhstan (5.2%, a difference of 0.33%), Immigrants from Ukraine (5.2%, a difference of 0.35%), and Alsatian (5.2%, a difference of 0.38%).
| Demographics | Rating | Rank | Married-Couple Family Poverty |
| Immigrants | Uganda | 54.9 /100 | #168 | Average 5.2% |
| Ottawa | 54.5 /100 | #169 | Average 5.2% |
| Immigrants | Argentina | 54.4 /100 | #170 | Average 5.2% |
| Bermudans | 52.9 /100 | #171 | Average 5.2% |
| Immigrants | Northern Africa | 51.3 /100 | #172 | Average 5.2% |
| Alsatians | 51.2 /100 | #173 | Average 5.2% |
| Immigrants | Eastern Africa | 50.0 /100 | #174 | Average 5.2% |
| Marshallese | 47.9 /100 | #175 | Average 5.2% |
| Menominee | 47.8 /100 | #176 | Average 5.2% |
| Immigrants | Kazakhstan | 45.1 /100 | #177 | Average 5.2% |
| Immigrants | Ukraine | 44.9 /100 | #178 | Average 5.2% |
| Spanish | 41.4 /100 | #179 | Average 5.3% |
| Immigrants | Sierra Leone | 39.3 /100 | #180 | Fair 5.3% |
| Immigrants | Chile | 38.8 /100 | #181 | Fair 5.3% |
| Immigrants | Vietnam | 37.7 /100 | #182 | Fair 5.3% |