Immigrants from St. Vincent and the Grenadines vs Soviet Union Married-Couple Family Poverty
COMPARE
Immigrants from St. Vincent and the Grenadines
Soviet Union
Married-Couple Family Poverty
Married-Couple Family Poverty Comparison
Immigrants from St. Vincent and the Grenadines
Soviet Union
7.1%
MARRIED-COUPLE FAMILY POVERTY
0.0/ 100
METRIC RATING
313th/ 347
METRIC RANK
4.9%
MARRIED-COUPLE FAMILY POVERTY
90.7/ 100
METRIC RATING
130th/ 347
METRIC RANK
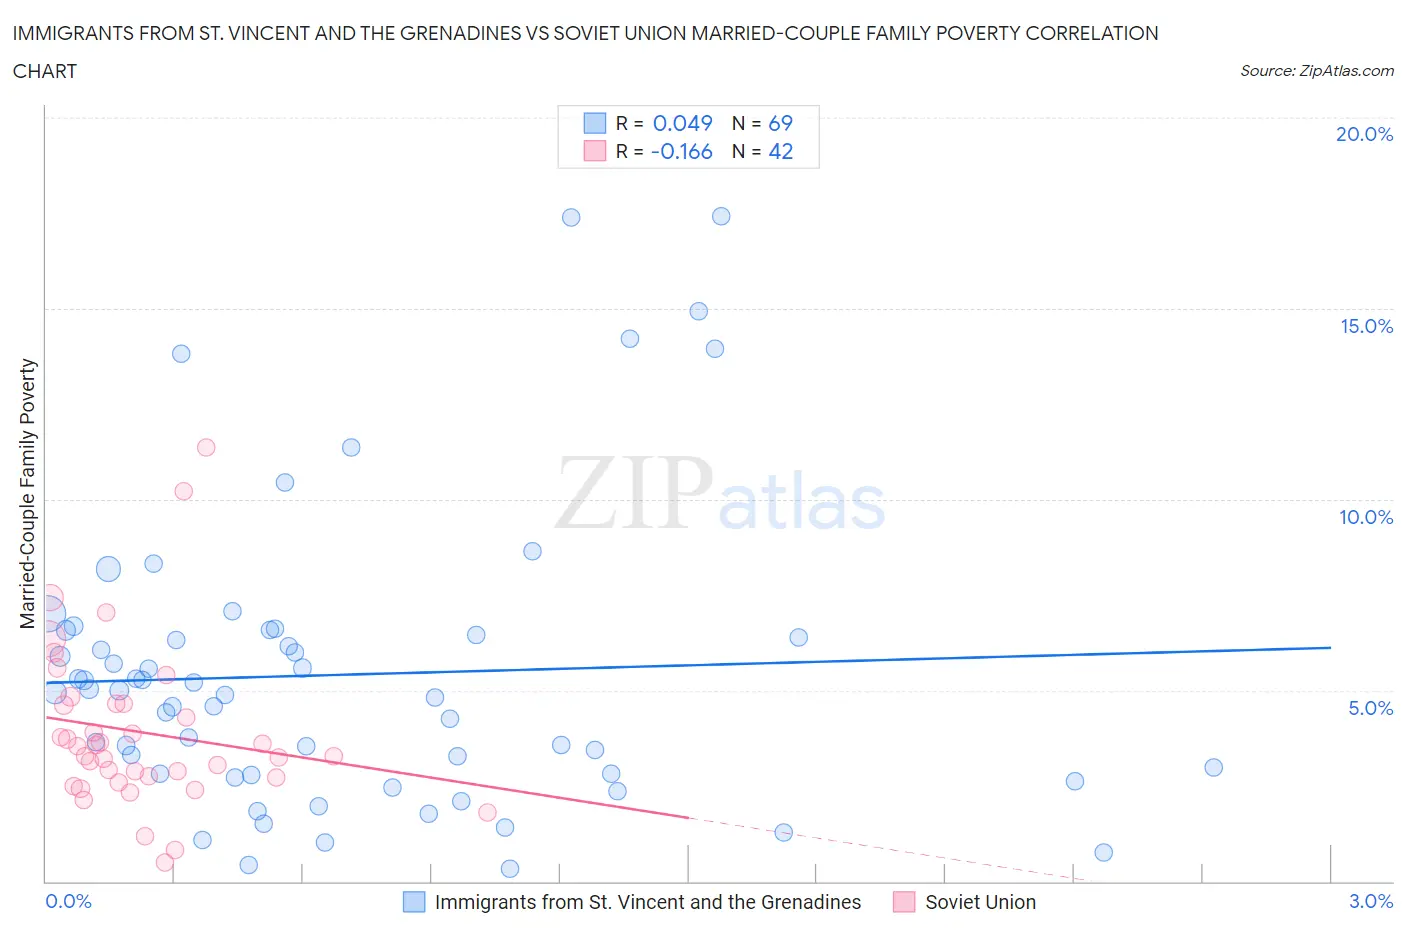
Immigrants from St. Vincent and the Grenadines vs Soviet Union Married-Couple Family Poverty Correlation Chart
The statistical analysis conducted on geographies consisting of 56,063,959 people shows no correlation between the proportion of Immigrants from St. Vincent and the Grenadines and poverty level among married-couple families in the United States with a correlation coefficient (R) of 0.049 and weighted average of 7.1%. Similarly, the statistical analysis conducted on geographies consisting of 43,419,717 people shows a poor negative correlation between the proportion of Soviet Union and poverty level among married-couple families in the United States with a correlation coefficient (R) of -0.166 and weighted average of 4.9%, a difference of 45.8%.
Married-Couple Family Poverty Correlation Summary
| Measurement | Immigrants from St. Vincent and the Grenadines | Soviet Union |
| Minimum | 0.34% | 0.48% |
| Maximum | 17.4% | 11.4% |
| Range | 17.1% | 10.9% |
| Mean | 5.4% | 3.9% |
| Median | 4.9% | 3.4% |
| Interquartile 25% (IQ1) | 2.8% | 2.7% |
| Interquartile 75% (IQ3) | 6.5% | 4.6% |
| Interquartile Range (IQR) | 3.7% | 1.9% |
| Standard Deviation (Sample) | 3.8% | 2.2% |
| Standard Deviation (Population) | 3.8% | 2.1% |
Similar Demographics by Married-Couple Family Poverty
Demographics Similar to Immigrants from St. Vincent and the Grenadines by Married-Couple Family Poverty
In terms of married-couple family poverty, the demographic groups most similar to Immigrants from St. Vincent and the Grenadines are Immigrants from Dominica (7.1%, a difference of 0.11%), Immigrants from Armenia (7.1%, a difference of 0.11%), Immigrants from Nicaragua (7.1%, a difference of 0.17%), Hopi (7.1%, a difference of 0.19%), and British West Indian (7.1%, a difference of 0.30%).
| Demographics | Rating | Rank | Married-Couple Family Poverty |
| Immigrants | Haiti | 0.0 /100 | #306 | Tragic 7.0% |
| Guatemalans | 0.0 /100 | #307 | Tragic 7.0% |
| Spanish American Indians | 0.0 /100 | #308 | Tragic 7.1% |
| Hopi | 0.0 /100 | #309 | Tragic 7.1% |
| Immigrants | Nicaragua | 0.0 /100 | #310 | Tragic 7.1% |
| Immigrants | Dominica | 0.0 /100 | #311 | Tragic 7.1% |
| Immigrants | Armenia | 0.0 /100 | #312 | Tragic 7.1% |
| Immigrants | St. Vincent and the Grenadines | 0.0 /100 | #313 | Tragic 7.1% |
| British West Indians | 0.0 /100 | #314 | Tragic 7.1% |
| Inupiat | 0.0 /100 | #315 | Tragic 7.1% |
| Hondurans | 0.0 /100 | #316 | Tragic 7.2% |
| Mexicans | 0.0 /100 | #317 | Tragic 7.2% |
| Immigrants | Guatemala | 0.0 /100 | #318 | Tragic 7.2% |
| Immigrants | Latin America | 0.0 /100 | #319 | Tragic 7.2% |
| Immigrants | Grenada | 0.0 /100 | #320 | Tragic 7.3% |
Demographics Similar to Soviet Union by Married-Couple Family Poverty
In terms of married-couple family poverty, the demographic groups most similar to Soviet Union are Immigrants from Pakistan (4.9%, a difference of 0.010%), Immigrants from Eastern Europe (4.9%, a difference of 0.070%), Puget Sound Salish (4.9%, a difference of 0.080%), Immigrants from Kenya (4.9%, a difference of 0.15%), and Samoan (4.9%, a difference of 0.16%).
| Demographics | Rating | Rank | Married-Couple Family Poverty |
| Jordanians | 93.1 /100 | #123 | Exceptional 4.8% |
| Romanians | 92.5 /100 | #124 | Exceptional 4.8% |
| Immigrants | Bosnia and Herzegovina | 92.5 /100 | #125 | Exceptional 4.8% |
| Immigrants | Asia | 92.3 /100 | #126 | Exceptional 4.8% |
| Egyptians | 92.0 /100 | #127 | Exceptional 4.8% |
| Palestinians | 91.2 /100 | #128 | Exceptional 4.9% |
| Immigrants | Pakistan | 90.7 /100 | #129 | Exceptional 4.9% |
| Soviet Union | 90.7 /100 | #130 | Exceptional 4.9% |
| Immigrants | Eastern Europe | 90.5 /100 | #131 | Exceptional 4.9% |
| Puget Sound Salish | 90.4 /100 | #132 | Exceptional 4.9% |
| Immigrants | Kenya | 90.2 /100 | #133 | Exceptional 4.9% |
| Samoans | 90.2 /100 | #134 | Exceptional 4.9% |
| Assyrians/Chaldeans/Syriacs | 89.4 /100 | #135 | Excellent 4.9% |
| Immigrants | Hungary | 88.7 /100 | #136 | Excellent 4.9% |
| Guamanians/Chamorros | 86.5 /100 | #137 | Excellent 4.9% |