Immigrants from St. Vincent and the Grenadines vs Immigrants from Greece Married-Couple Family Poverty
COMPARE
Immigrants from St. Vincent and the Grenadines
Immigrants from Greece
Married-Couple Family Poverty
Married-Couple Family Poverty Comparison
Immigrants from St. Vincent and the Grenadines
Immigrants from Greece
7.1%
MARRIED-COUPLE FAMILY POVERTY
0.0/ 100
METRIC RATING
313th/ 347
METRIC RANK
4.5%
MARRIED-COUPLE FAMILY POVERTY
98.9/ 100
METRIC RATING
81st/ 347
METRIC RANK
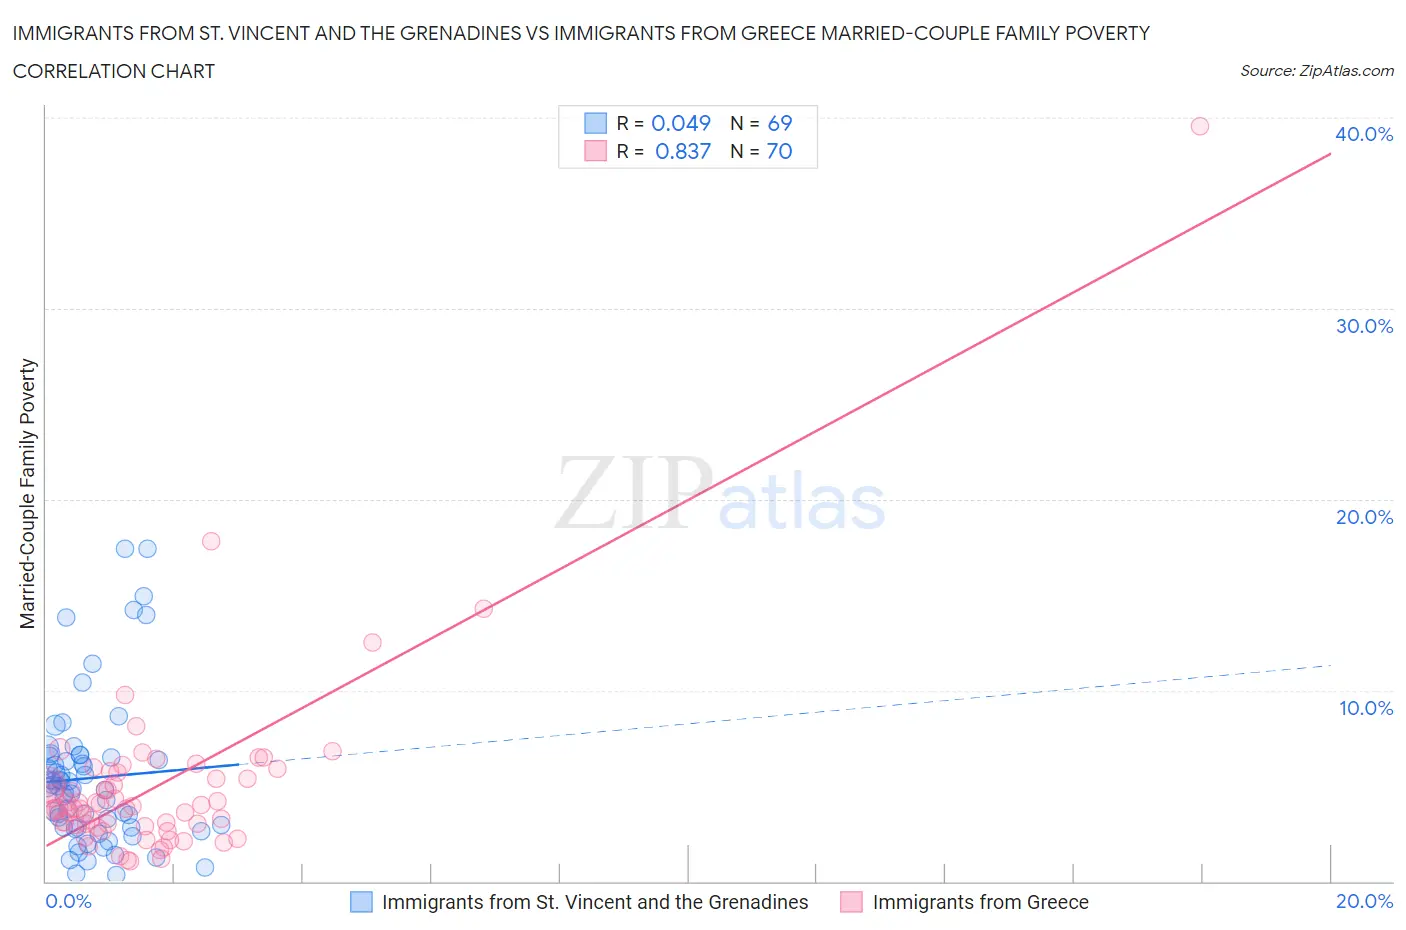
Immigrants from St. Vincent and the Grenadines vs Immigrants from Greece Married-Couple Family Poverty Correlation Chart
The statistical analysis conducted on geographies consisting of 56,063,959 people shows no correlation between the proportion of Immigrants from St. Vincent and the Grenadines and poverty level among married-couple families in the United States with a correlation coefficient (R) of 0.049 and weighted average of 7.1%. Similarly, the statistical analysis conducted on geographies consisting of 215,639,797 people shows a very strong positive correlation between the proportion of Immigrants from Greece and poverty level among married-couple families in the United States with a correlation coefficient (R) of 0.837 and weighted average of 4.5%, a difference of 56.8%.
Married-Couple Family Poverty Correlation Summary
| Measurement | Immigrants from St. Vincent and the Grenadines | Immigrants from Greece |
| Minimum | 0.34% | 1.1% |
| Maximum | 17.4% | 39.5% |
| Range | 17.1% | 38.5% |
| Mean | 5.4% | 5.0% |
| Median | 4.9% | 3.9% |
| Interquartile 25% (IQ1) | 2.8% | 3.0% |
| Interquartile 75% (IQ3) | 6.5% | 5.7% |
| Interquartile Range (IQR) | 3.7% | 2.7% |
| Standard Deviation (Sample) | 3.8% | 5.1% |
| Standard Deviation (Population) | 3.8% | 5.0% |
Similar Demographics by Married-Couple Family Poverty
Demographics Similar to Immigrants from St. Vincent and the Grenadines by Married-Couple Family Poverty
In terms of married-couple family poverty, the demographic groups most similar to Immigrants from St. Vincent and the Grenadines are Immigrants from Dominica (7.1%, a difference of 0.11%), Immigrants from Armenia (7.1%, a difference of 0.11%), Immigrants from Nicaragua (7.1%, a difference of 0.17%), Hopi (7.1%, a difference of 0.19%), and British West Indian (7.1%, a difference of 0.30%).
| Demographics | Rating | Rank | Married-Couple Family Poverty |
| Immigrants | Haiti | 0.0 /100 | #306 | Tragic 7.0% |
| Guatemalans | 0.0 /100 | #307 | Tragic 7.0% |
| Spanish American Indians | 0.0 /100 | #308 | Tragic 7.1% |
| Hopi | 0.0 /100 | #309 | Tragic 7.1% |
| Immigrants | Nicaragua | 0.0 /100 | #310 | Tragic 7.1% |
| Immigrants | Dominica | 0.0 /100 | #311 | Tragic 7.1% |
| Immigrants | Armenia | 0.0 /100 | #312 | Tragic 7.1% |
| Immigrants | St. Vincent and the Grenadines | 0.0 /100 | #313 | Tragic 7.1% |
| British West Indians | 0.0 /100 | #314 | Tragic 7.1% |
| Inupiat | 0.0 /100 | #315 | Tragic 7.1% |
| Hondurans | 0.0 /100 | #316 | Tragic 7.2% |
| Mexicans | 0.0 /100 | #317 | Tragic 7.2% |
| Immigrants | Guatemala | 0.0 /100 | #318 | Tragic 7.2% |
| Immigrants | Latin America | 0.0 /100 | #319 | Tragic 7.2% |
| Immigrants | Grenada | 0.0 /100 | #320 | Tragic 7.3% |
Demographics Similar to Immigrants from Greece by Married-Couple Family Poverty
In terms of married-couple family poverty, the demographic groups most similar to Immigrants from Greece are Icelander (4.5%, a difference of 0.14%), Immigrants from Iran (4.5%, a difference of 0.20%), Canadian (4.5%, a difference of 0.25%), Immigrants from Denmark (4.6%, a difference of 0.41%), and Scotch-Irish (4.5%, a difference of 0.44%).
| Demographics | Rating | Rank | Married-Couple Family Poverty |
| Immigrants | Austria | 99.2 /100 | #74 | Exceptional 4.5% |
| Cambodians | 99.2 /100 | #75 | Exceptional 4.5% |
| Immigrants | South Africa | 99.1 /100 | #76 | Exceptional 4.5% |
| Immigrants | Latvia | 99.1 /100 | #77 | Exceptional 4.5% |
| Scotch-Irish | 99.1 /100 | #78 | Exceptional 4.5% |
| Immigrants | Iran | 99.0 /100 | #79 | Exceptional 4.5% |
| Icelanders | 99.0 /100 | #80 | Exceptional 4.5% |
| Immigrants | Greece | 98.9 /100 | #81 | Exceptional 4.5% |
| Canadians | 98.8 /100 | #82 | Exceptional 4.5% |
| Immigrants | Denmark | 98.8 /100 | #83 | Exceptional 4.6% |
| Immigrants | Croatia | 98.7 /100 | #84 | Exceptional 4.6% |
| South Africans | 98.7 /100 | #85 | Exceptional 4.6% |
| Immigrants | Turkey | 98.6 /100 | #86 | Exceptional 4.6% |
| Immigrants | North Macedonia | 98.6 /100 | #87 | Exceptional 4.6% |
| Bolivians | 98.6 /100 | #88 | Exceptional 4.6% |