Immigrants from St. Vincent and the Grenadines vs Arapaho Married-Couple Family Poverty
COMPARE
Immigrants from St. Vincent and the Grenadines
Arapaho
Married-Couple Family Poverty
Married-Couple Family Poverty Comparison
Immigrants from St. Vincent and the Grenadines
Arapaho
7.1%
MARRIED-COUPLE FAMILY POVERTY
0.0/ 100
METRIC RATING
313th/ 347
METRIC RANK
6.6%
MARRIED-COUPLE FAMILY POVERTY
0.0/ 100
METRIC RATING
293rd/ 347
METRIC RANK
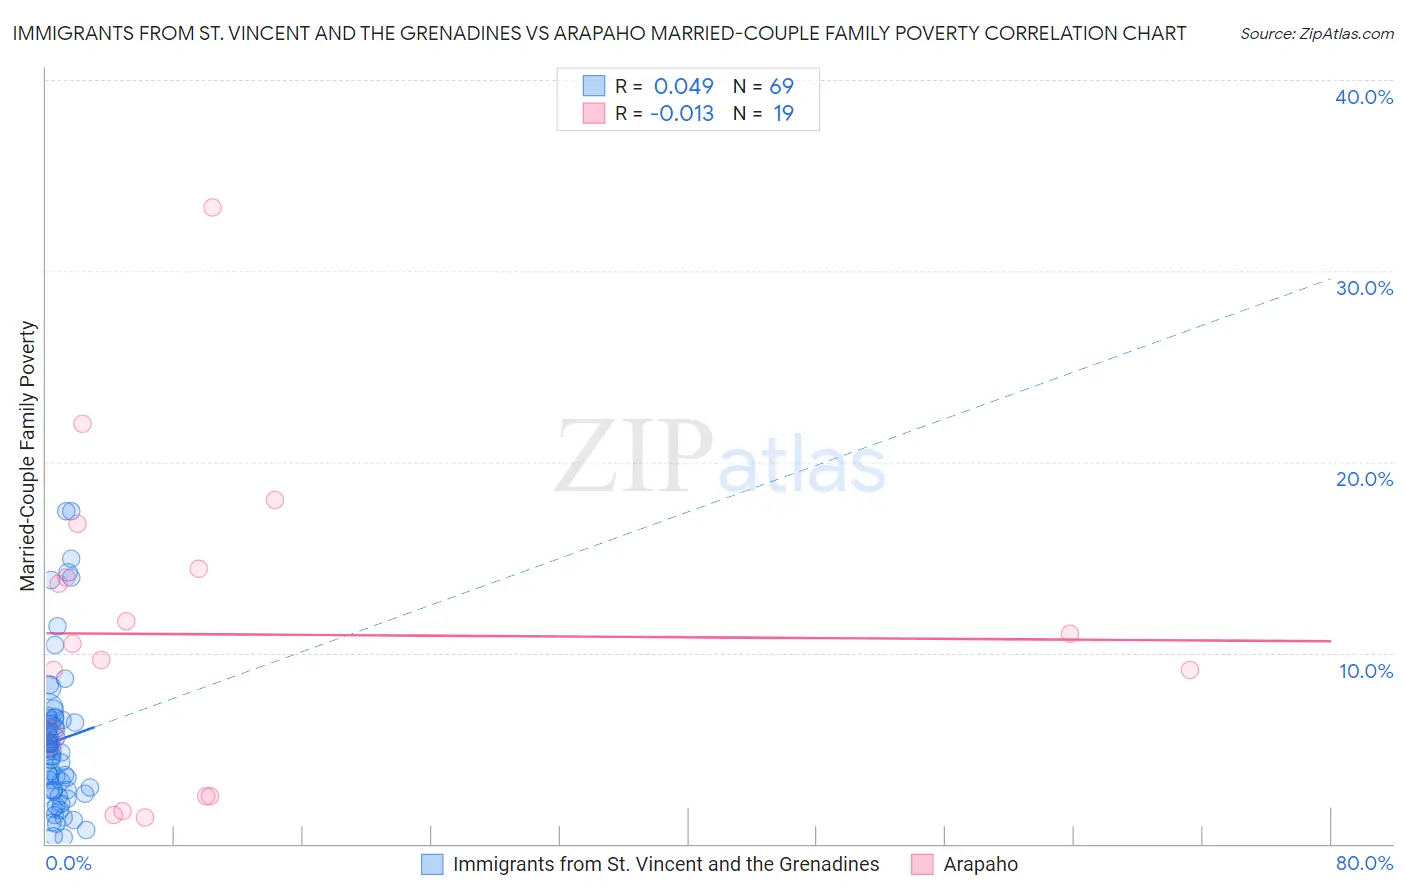
Immigrants from St. Vincent and the Grenadines vs Arapaho Married-Couple Family Poverty Correlation Chart
The statistical analysis conducted on geographies consisting of 56,063,959 people shows no correlation between the proportion of Immigrants from St. Vincent and the Grenadines and poverty level among married-couple families in the United States with a correlation coefficient (R) of 0.049 and weighted average of 7.1%. Similarly, the statistical analysis conducted on geographies consisting of 29,746,597 people shows no correlation between the proportion of Arapaho and poverty level among married-couple families in the United States with a correlation coefficient (R) of -0.013 and weighted average of 6.6%, a difference of 8.2%.
Married-Couple Family Poverty Correlation Summary
| Measurement | Immigrants from St. Vincent and the Grenadines | Arapaho |
| Minimum | 0.34% | 1.4% |
| Maximum | 17.4% | 33.3% |
| Range | 17.1% | 31.9% |
| Mean | 5.4% | 11.0% |
| Median | 4.9% | 10.5% |
| Interquartile 25% (IQ1) | 2.8% | 2.5% |
| Interquartile 75% (IQ3) | 6.5% | 14.4% |
| Interquartile Range (IQR) | 3.7% | 11.9% |
| Standard Deviation (Sample) | 3.8% | 8.1% |
| Standard Deviation (Population) | 3.8% | 7.9% |
Demographics Similar to Immigrants from St. Vincent and the Grenadines and Arapaho by Married-Couple Family Poverty
In terms of married-couple family poverty, the demographic groups most similar to Immigrants from St. Vincent and the Grenadines are Immigrants from Dominica (7.1%, a difference of 0.11%), Immigrants from Armenia (7.1%, a difference of 0.11%), Immigrants from Nicaragua (7.1%, a difference of 0.17%), Hopi (7.1%, a difference of 0.19%), and Spanish American Indian (7.1%, a difference of 0.79%). Similarly, the demographic groups most similar to Arapaho are Bahamian (6.6%, a difference of 0.85%), Immigrants from Uzbekistan (6.6%, a difference of 1.1%), U.S. Virgin Islander (6.6%, a difference of 1.2%), Kiowa (6.6%, a difference of 1.3%), and Immigrants from Guyana (6.7%, a difference of 1.3%).
| Demographics | Rating | Rank | Married-Couple Family Poverty |
| Arapaho | 0.0 /100 | #293 | Tragic 6.6% |
| Bahamians | 0.0 /100 | #294 | Tragic 6.6% |
| Immigrants | Uzbekistan | 0.0 /100 | #295 | Tragic 6.6% |
| U.S. Virgin Islanders | 0.0 /100 | #296 | Tragic 6.6% |
| Kiowa | 0.0 /100 | #297 | Tragic 6.6% |
| Immigrants | Guyana | 0.0 /100 | #298 | Tragic 6.7% |
| Nicaraguans | 0.0 /100 | #299 | Tragic 6.7% |
| Immigrants | Belize | 0.0 /100 | #300 | Tragic 6.7% |
| Central Americans | 0.0 /100 | #301 | Tragic 6.7% |
| Immigrants | Ecuador | 0.0 /100 | #302 | Tragic 6.7% |
| Immigrants | El Salvador | 0.0 /100 | #303 | Tragic 6.8% |
| Cubans | 0.0 /100 | #304 | Tragic 6.8% |
| Haitians | 0.0 /100 | #305 | Tragic 6.8% |
| Immigrants | Haiti | 0.0 /100 | #306 | Tragic 7.0% |
| Guatemalans | 0.0 /100 | #307 | Tragic 7.0% |
| Spanish American Indians | 0.0 /100 | #308 | Tragic 7.1% |
| Hopi | 0.0 /100 | #309 | Tragic 7.1% |
| Immigrants | Nicaragua | 0.0 /100 | #310 | Tragic 7.1% |
| Immigrants | Dominica | 0.0 /100 | #311 | Tragic 7.1% |
| Immigrants | Armenia | 0.0 /100 | #312 | Tragic 7.1% |
| Immigrants | St. Vincent and the Grenadines | 0.0 /100 | #313 | Tragic 7.1% |