European vs Puerto Rican Married-Couple Family Poverty
COMPARE
European
Puerto Rican
Married-Couple Family Poverty
Married-Couple Family Poverty Comparison
Europeans
Puerto Ricans
4.2%
MARRIED-COUPLE FAMILY POVERTY
99.9/ 100
METRIC RATING
35th/ 347
METRIC RANK
12.6%
MARRIED-COUPLE FAMILY POVERTY
0.0/ 100
METRIC RATING
345th/ 347
METRIC RANK
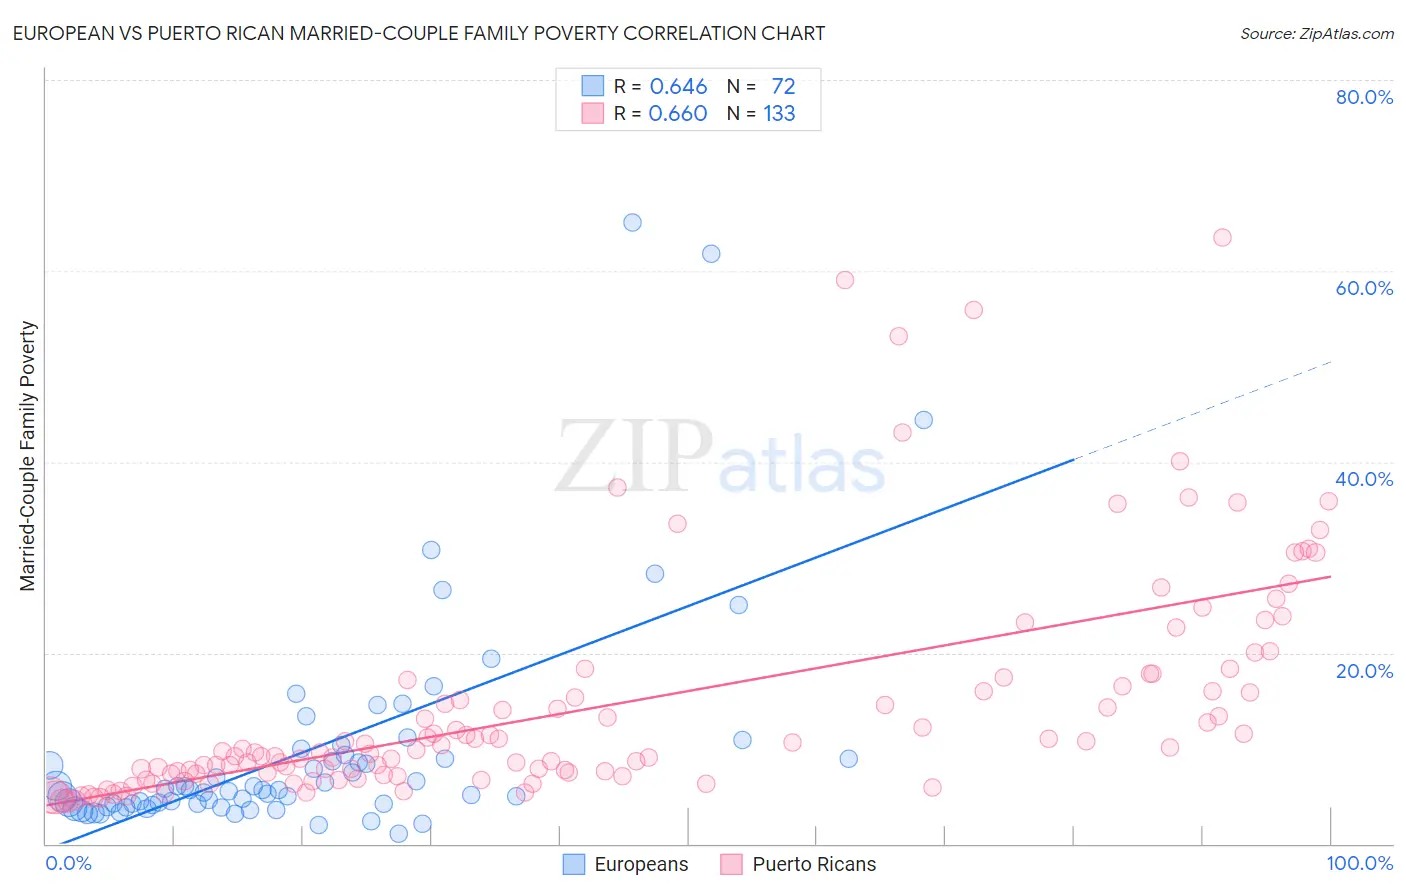
European vs Puerto Rican Married-Couple Family Poverty Correlation Chart
The statistical analysis conducted on geographies consisting of 548,741,154 people shows a significant positive correlation between the proportion of Europeans and poverty level among married-couple families in the United States with a correlation coefficient (R) of 0.646 and weighted average of 4.2%. Similarly, the statistical analysis conducted on geographies consisting of 519,143,813 people shows a significant positive correlation between the proportion of Puerto Ricans and poverty level among married-couple families in the United States with a correlation coefficient (R) of 0.660 and weighted average of 12.6%, a difference of 199.2%.
Married-Couple Family Poverty Correlation Summary
| Measurement | European | Puerto Rican |
| Minimum | 1.0% | 4.4% |
| Maximum | 65.0% | 63.5% |
| Range | 64.0% | 59.1% |
| Mean | 9.7% | 14.4% |
| Median | 5.6% | 9.7% |
| Interquartile 25% (IQ1) | 4.1% | 7.2% |
| Interquartile 75% (IQ3) | 9.1% | 16.9% |
| Interquartile Range (IQR) | 5.0% | 9.6% |
| Standard Deviation (Sample) | 11.8% | 11.7% |
| Standard Deviation (Population) | 11.7% | 11.7% |
Similar Demographics by Married-Couple Family Poverty
Demographics Similar to Europeans by Married-Couple Family Poverty
In terms of married-couple family poverty, the demographic groups most similar to Europeans are English (4.2%, a difference of 0.030%), Iranian (4.2%, a difference of 0.10%), Belgian (4.2%, a difference of 0.22%), Immigrants from Northern Europe (4.2%, a difference of 0.35%), and Dutch (4.2%, a difference of 0.57%).
| Demographics | Rating | Rank | Married-Couple Family Poverty |
| Scandinavians | 99.9 /100 | #28 | Exceptional 4.1% |
| Immigrants | Scotland | 99.9 /100 | #29 | Exceptional 4.2% |
| Finns | 99.9 /100 | #30 | Exceptional 4.2% |
| Estonians | 99.9 /100 | #31 | Exceptional 4.2% |
| Greeks | 99.9 /100 | #32 | Exceptional 4.2% |
| Irish | 99.9 /100 | #33 | Exceptional 4.2% |
| Dutch | 99.9 /100 | #34 | Exceptional 4.2% |
| Europeans | 99.9 /100 | #35 | Exceptional 4.2% |
| English | 99.9 /100 | #36 | Exceptional 4.2% |
| Iranians | 99.9 /100 | #37 | Exceptional 4.2% |
| Belgians | 99.9 /100 | #38 | Exceptional 4.2% |
| Immigrants | Northern Europe | 99.8 /100 | #39 | Exceptional 4.2% |
| French Canadians | 99.8 /100 | #40 | Exceptional 4.2% |
| Northern Europeans | 99.8 /100 | #41 | Exceptional 4.3% |
| Scottish | 99.8 /100 | #42 | Exceptional 4.3% |
Demographics Similar to Puerto Ricans by Married-Couple Family Poverty
In terms of married-couple family poverty, the demographic groups most similar to Puerto Ricans are Immigrants from Yemen (12.8%, a difference of 1.3%), Yup'ik (13.4%, a difference of 6.0%), Navajo (11.9%, a difference of 6.6%), Pima (11.4%, a difference of 10.8%), and Tohono O'odham (11.2%, a difference of 12.6%).
| Demographics | Rating | Rank | Married-Couple Family Poverty |
| Lumbee | 0.0 /100 | #333 | Tragic 8.3% |
| Immigrants | Dominican Republic | 0.0 /100 | #334 | Tragic 8.4% |
| Sioux | 0.0 /100 | #335 | Tragic 8.7% |
| Apache | 0.0 /100 | #336 | Tragic 9.0% |
| Yakama | 0.0 /100 | #337 | Tragic 9.0% |
| Cheyenne | 0.0 /100 | #338 | Tragic 9.4% |
| Crow | 0.0 /100 | #339 | Tragic 9.6% |
| Yuman | 0.0 /100 | #340 | Tragic 9.7% |
| Pueblo | 0.0 /100 | #341 | Tragic 11.1% |
| Tohono O'odham | 0.0 /100 | #342 | Tragic 11.2% |
| Pima | 0.0 /100 | #343 | Tragic 11.4% |
| Navajo | 0.0 /100 | #344 | Tragic 11.9% |
| Puerto Ricans | 0.0 /100 | #345 | Tragic 12.6% |
| Immigrants | Yemen | 0.0 /100 | #346 | Tragic 12.8% |
| Yup'ik | 0.0 /100 | #347 | Tragic 13.4% |