Immigrants from St. Vincent and the Grenadines vs Puerto Rican Unemployment
COMPARE
Immigrants from St. Vincent and the Grenadines
Puerto Rican
Unemployment
Unemployment Comparison
Immigrants from St. Vincent and the Grenadines
Puerto Ricans
6.9%
UNEMPLOYMENT
0.0/ 100
METRIC RATING
320th/ 347
METRIC RANK
8.4%
UNEMPLOYMENT
0.0/ 100
METRIC RATING
340th/ 347
METRIC RANK
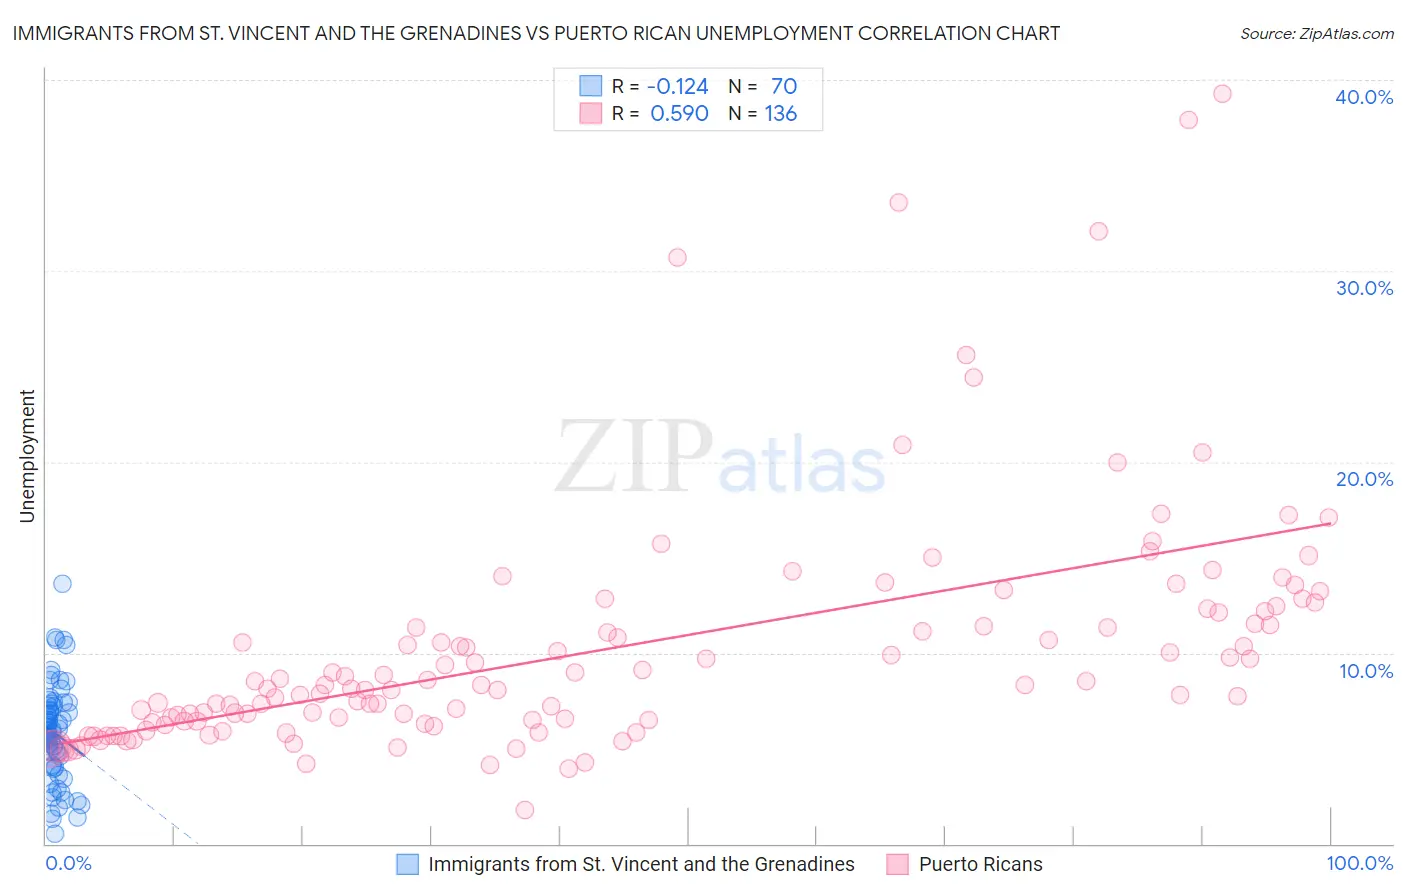
Immigrants from St. Vincent and the Grenadines vs Puerto Rican Unemployment Correlation Chart
The statistical analysis conducted on geographies consisting of 56,184,646 people shows a poor negative correlation between the proportion of Immigrants from St. Vincent and the Grenadines and unemployment in the United States with a correlation coefficient (R) of -0.124 and weighted average of 6.9%. Similarly, the statistical analysis conducted on geographies consisting of 526,845,718 people shows a substantial positive correlation between the proportion of Puerto Ricans and unemployment in the United States with a correlation coefficient (R) of 0.590 and weighted average of 8.4%, a difference of 22.2%.
Unemployment Correlation Summary
| Measurement | Immigrants from St. Vincent and the Grenadines | Puerto Rican |
| Minimum | 0.50% | 1.8% |
| Maximum | 13.6% | 39.3% |
| Range | 13.1% | 37.5% |
| Mean | 5.8% | 10.2% |
| Median | 5.8% | 8.3% |
| Interquartile 25% (IQ1) | 4.1% | 6.4% |
| Interquartile 75% (IQ3) | 7.2% | 11.8% |
| Interquartile Range (IQR) | 3.1% | 5.4% |
| Standard Deviation (Sample) | 2.6% | 6.3% |
| Standard Deviation (Population) | 2.5% | 6.3% |
Demographics Similar to Immigrants from St. Vincent and the Grenadines and Puerto Ricans by Unemployment
In terms of unemployment, the demographic groups most similar to Immigrants from St. Vincent and the Grenadines are Immigrants from Guyana (6.9%, a difference of 0.010%), Guyanese (6.9%, a difference of 0.050%), Immigrants from Grenada (6.9%, a difference of 0.37%), Immigrants from Armenia (7.0%, a difference of 1.5%), and Native/Alaskan (7.0%, a difference of 2.1%). Similarly, the demographic groups most similar to Puerto Ricans are Navajo (8.4%, a difference of 0.79%), Pima (8.2%, a difference of 2.4%), Cheyenne (8.0%, a difference of 5.2%), Immigrants from Yemen (7.7%, a difference of 9.2%), and Alaskan Athabascan (7.7%, a difference of 10.0%).
| Demographics | Rating | Rank | Unemployment |
| Immigrants | St. Vincent and the Grenadines | 0.0 /100 | #320 | Tragic 6.9% |
| Immigrants | Guyana | 0.0 /100 | #321 | Tragic 6.9% |
| Guyanese | 0.0 /100 | #322 | Tragic 6.9% |
| Immigrants | Grenada | 0.0 /100 | #323 | Tragic 6.9% |
| Immigrants | Armenia | 0.0 /100 | #324 | Tragic 7.0% |
| Natives/Alaskans | 0.0 /100 | #325 | Tragic 7.0% |
| Paiute | 0.0 /100 | #326 | Tragic 7.1% |
| Pueblo | 0.0 /100 | #327 | Tragic 7.2% |
| Tsimshian | 0.0 /100 | #328 | Tragic 7.2% |
| Alaska Natives | 0.0 /100 | #329 | Tragic 7.2% |
| Yakama | 0.0 /100 | #330 | Tragic 7.3% |
| Dominicans | 0.0 /100 | #331 | Tragic 7.4% |
| Sioux | 0.0 /100 | #332 | Tragic 7.4% |
| Immigrants | Dominican Republic | 0.0 /100 | #333 | Tragic 7.4% |
| Apache | 0.0 /100 | #334 | Tragic 7.4% |
| Alaskan Athabascans | 0.0 /100 | #335 | Tragic 7.7% |
| Immigrants | Yemen | 0.0 /100 | #336 | Tragic 7.7% |
| Cheyenne | 0.0 /100 | #337 | Tragic 8.0% |
| Pima | 0.0 /100 | #338 | Tragic 8.2% |
| Navajo | 0.0 /100 | #339 | Tragic 8.4% |
| Puerto Ricans | 0.0 /100 | #340 | Tragic 8.4% |