Immigrants from Romania vs Tohono O'odham Female Poverty
COMPARE
Immigrants from Romania
Tohono O'odham
Female Poverty
Female Poverty Comparison
Immigrants from Romania
Tohono O'odham
12.0%
FEMALE POVERTY
99.0/ 100
METRIC RATING
49th/ 347
METRIC RANK
25.9%
FEMALE POVERTY
0.0/ 100
METRIC RATING
347th/ 347
METRIC RANK
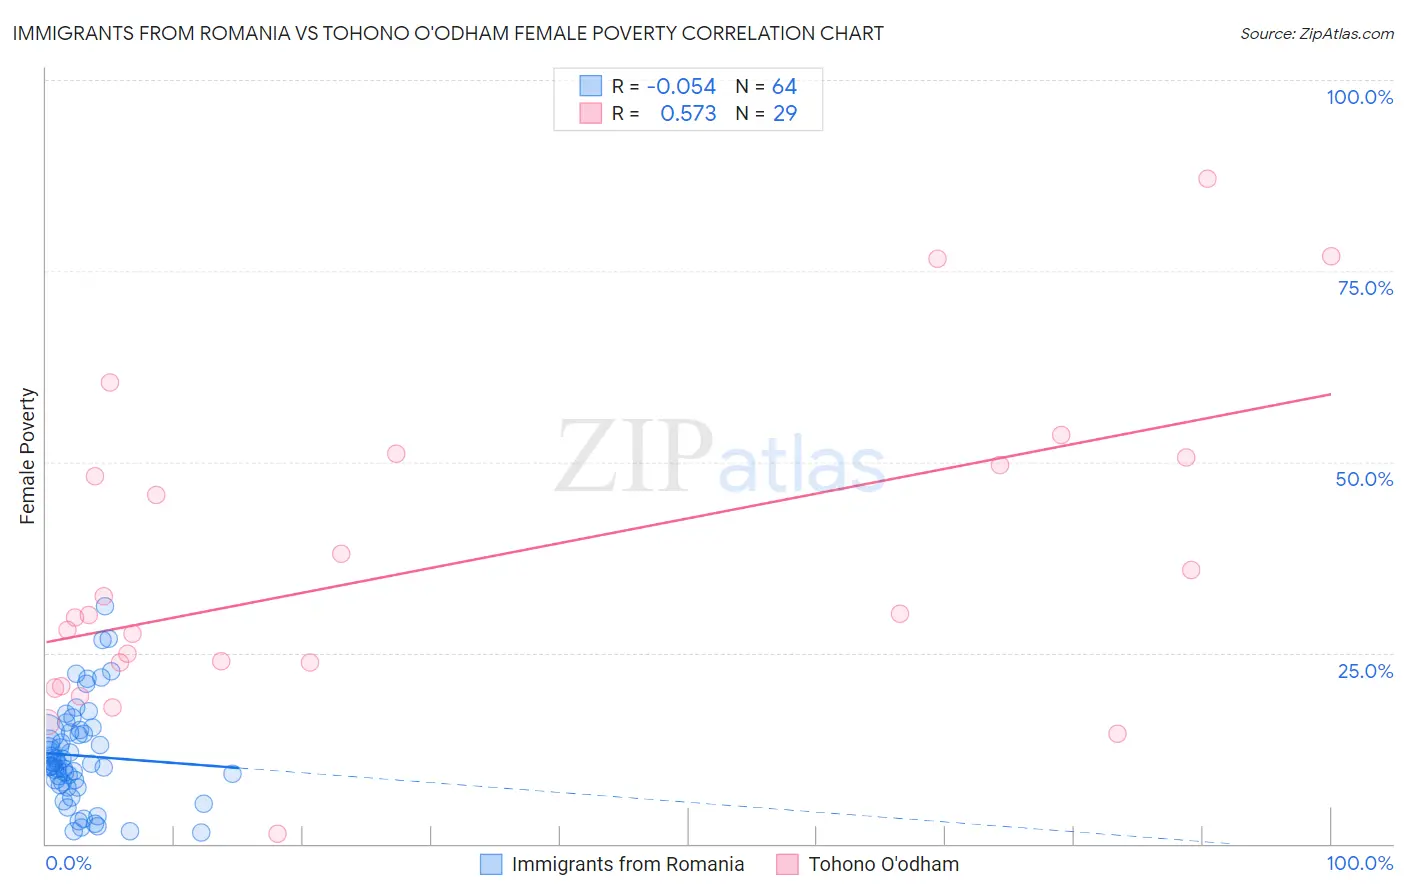
Immigrants from Romania vs Tohono O'odham Female Poverty Correlation Chart
The statistical analysis conducted on geographies consisting of 256,918,121 people shows a slight negative correlation between the proportion of Immigrants from Romania and poverty level among females in the United States with a correlation coefficient (R) of -0.054 and weighted average of 12.0%. Similarly, the statistical analysis conducted on geographies consisting of 58,715,136 people shows a substantial positive correlation between the proportion of Tohono O'odham and poverty level among females in the United States with a correlation coefficient (R) of 0.573 and weighted average of 25.9%, a difference of 116.7%.
Female Poverty Correlation Summary
| Measurement | Immigrants from Romania | Tohono O'odham |
| Minimum | 1.5% | 1.4% |
| Maximum | 31.2% | 87.1% |
| Range | 29.7% | 85.7% |
| Mean | 11.5% | 36.5% |
| Median | 10.5% | 30.0% |
| Interquartile 25% (IQ1) | 7.9% | 22.2% |
| Interquartile 75% (IQ3) | 14.6% | 50.0% |
| Interquartile Range (IQR) | 6.7% | 27.9% |
| Standard Deviation (Sample) | 6.5% | 20.4% |
| Standard Deviation (Population) | 6.4% | 20.1% |
Similar Demographics by Female Poverty
Demographics Similar to Immigrants from Romania by Female Poverty
In terms of female poverty, the demographic groups most similar to Immigrants from Romania are Slovene (12.0%, a difference of 0.010%), Immigrants from Japan (11.9%, a difference of 0.19%), Immigrants from Bulgaria (12.0%, a difference of 0.23%), Asian (11.9%, a difference of 0.42%), and Immigrants from Croatia (12.0%, a difference of 0.54%).
| Demographics | Rating | Rank | Female Poverty |
| Immigrants | Moldova | 99.2 /100 | #42 | Exceptional 11.9% |
| Koreans | 99.2 /100 | #43 | Exceptional 11.9% |
| Tongans | 99.2 /100 | #44 | Exceptional 11.9% |
| Immigrants | Czechoslovakia | 99.2 /100 | #45 | Exceptional 11.9% |
| Turks | 99.2 /100 | #46 | Exceptional 11.9% |
| Asians | 99.1 /100 | #47 | Exceptional 11.9% |
| Immigrants | Japan | 99.0 /100 | #48 | Exceptional 11.9% |
| Immigrants | Romania | 99.0 /100 | #49 | Exceptional 12.0% |
| Slovenes | 98.9 /100 | #50 | Exceptional 12.0% |
| Immigrants | Bulgaria | 98.9 /100 | #51 | Exceptional 12.0% |
| Immigrants | Croatia | 98.7 /100 | #52 | Exceptional 12.0% |
| Immigrants | Austria | 98.7 /100 | #53 | Exceptional 12.0% |
| Immigrants | Philippines | 98.7 /100 | #54 | Exceptional 12.1% |
| Immigrants | Sri Lanka | 98.5 /100 | #55 | Exceptional 12.1% |
| Estonians | 98.3 /100 | #56 | Exceptional 12.1% |
Demographics Similar to Tohono O'odham by Female Poverty
In terms of female poverty, the demographic groups most similar to Tohono O'odham are Puerto Rican (25.2%, a difference of 3.0%), Navajo (23.9%, a difference of 8.6%), Pima (23.6%, a difference of 10.0%), Lumbee (23.5%, a difference of 10.3%), and Immigrants from Yemen (22.8%, a difference of 13.6%).
| Demographics | Rating | Rank | Female Poverty |
| Immigrants | Dominican Republic | 0.0 /100 | #333 | Tragic 19.3% |
| Houma | 0.0 /100 | #334 | Tragic 20.0% |
| Cheyenne | 0.0 /100 | #335 | Tragic 20.2% |
| Pueblo | 0.0 /100 | #336 | Tragic 20.7% |
| Yuman | 0.0 /100 | #337 | Tragic 20.8% |
| Sioux | 0.0 /100 | #338 | Tragic 20.9% |
| Hopi | 0.0 /100 | #339 | Tragic 21.0% |
| Yup'ik | 0.0 /100 | #340 | Tragic 21.5% |
| Crow | 0.0 /100 | #341 | Tragic 22.1% |
| Immigrants | Yemen | 0.0 /100 | #342 | Tragic 22.8% |
| Lumbee | 0.0 /100 | #343 | Tragic 23.5% |
| Pima | 0.0 /100 | #344 | Tragic 23.6% |
| Navajo | 0.0 /100 | #345 | Tragic 23.9% |
| Puerto Ricans | 0.0 /100 | #346 | Tragic 25.2% |
| Tohono O'odham | 0.0 /100 | #347 | Tragic 25.9% |