Immigrants from Romania vs Tohono O'odham Male Unemployment
COMPARE
Immigrants from Romania
Tohono O'odham
Male Unemployment
Male Unemployment Comparison
Immigrants from Romania
Tohono O'odham
5.1%
MALE UNEMPLOYMENT
95.4/ 100
METRIC RATING
87th/ 347
METRIC RANK
10.2%
MALE UNEMPLOYMENT
0.0/ 100
METRIC RATING
342nd/ 347
METRIC RANK
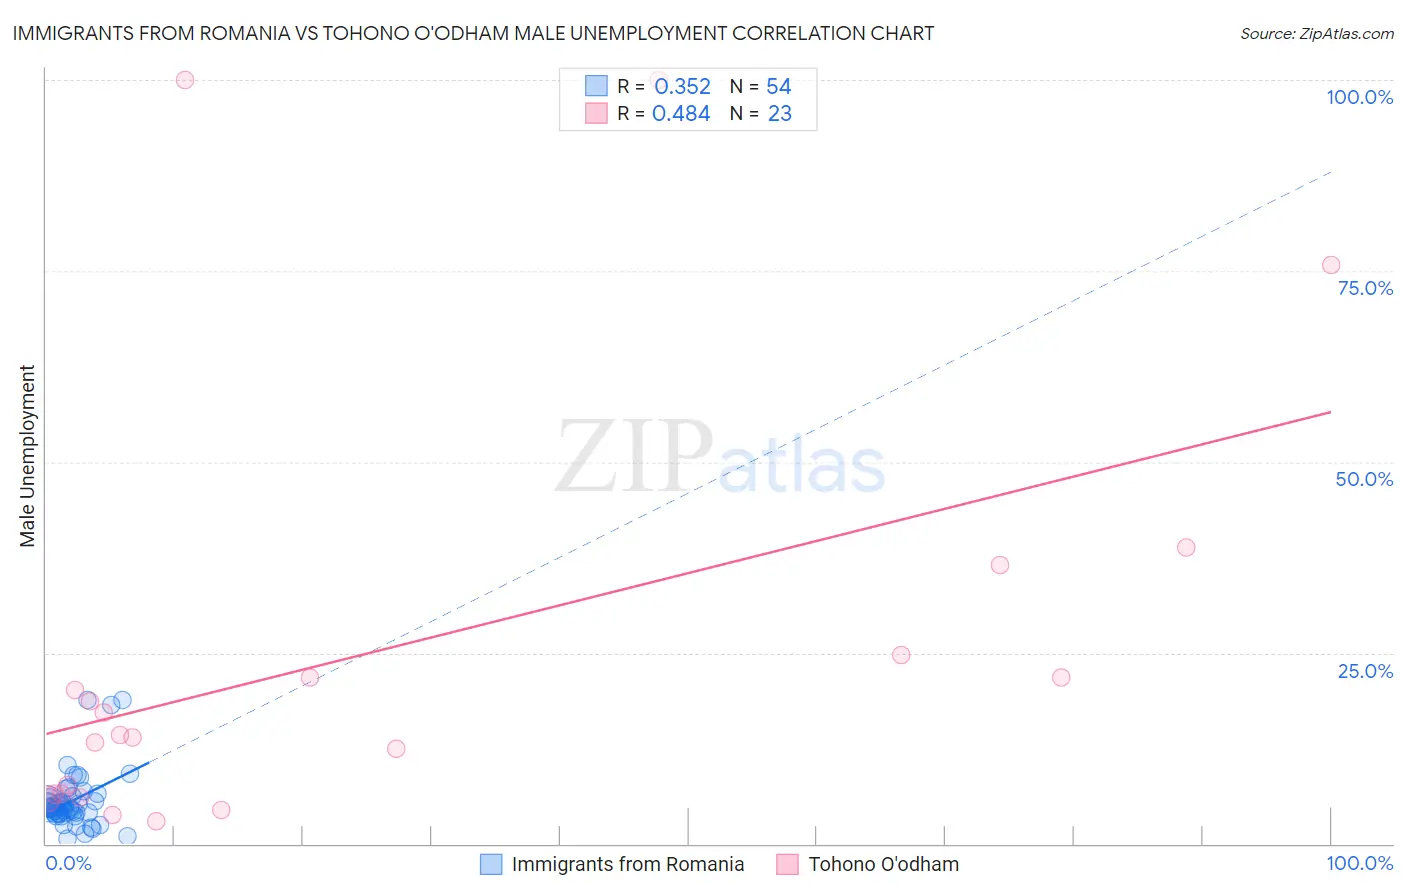
Immigrants from Romania vs Tohono O'odham Male Unemployment Correlation Chart
The statistical analysis conducted on geographies consisting of 256,547,728 people shows a mild positive correlation between the proportion of Immigrants from Romania and unemployment rate among males in the United States with a correlation coefficient (R) of 0.352 and weighted average of 5.1%. Similarly, the statistical analysis conducted on geographies consisting of 58,664,487 people shows a moderate positive correlation between the proportion of Tohono O'odham and unemployment rate among males in the United States with a correlation coefficient (R) of 0.484 and weighted average of 10.2%, a difference of 100.9%.
Male Unemployment Correlation Summary
| Measurement | Immigrants from Romania | Tohono O'odham |
| Minimum | 0.60% | 2.9% |
| Maximum | 18.8% | 100.0% |
| Range | 18.2% | 97.1% |
| Mean | 5.6% | 24.9% |
| Median | 4.8% | 14.2% |
| Interquartile 25% (IQ1) | 4.0% | 6.5% |
| Interquartile 75% (IQ3) | 5.7% | 24.7% |
| Interquartile Range (IQR) | 1.7% | 18.2% |
| Standard Deviation (Sample) | 3.8% | 28.5% |
| Standard Deviation (Population) | 3.7% | 27.9% |
Similar Demographics by Male Unemployment
Demographics Similar to Immigrants from Romania by Male Unemployment
In terms of male unemployment, the demographic groups most similar to Immigrants from Romania are Maltese (5.1%, a difference of 0.020%), Immigrants from North Macedonia (5.1%, a difference of 0.060%), Serbian (5.1%, a difference of 0.11%), Immigrants from Sri Lanka (5.1%, a difference of 0.19%), and Immigrants from Eritrea (5.0%, a difference of 0.22%).
| Demographics | Rating | Rank | Male Unemployment |
| Argentineans | 96.2 /100 | #80 | Exceptional 5.0% |
| French | 96.2 /100 | #81 | Exceptional 5.0% |
| Chileans | 96.2 /100 | #82 | Exceptional 5.0% |
| Immigrants | Eritrea | 96.0 /100 | #83 | Exceptional 5.0% |
| Serbians | 95.7 /100 | #84 | Exceptional 5.1% |
| Immigrants | North Macedonia | 95.6 /100 | #85 | Exceptional 5.1% |
| Maltese | 95.5 /100 | #86 | Exceptional 5.1% |
| Immigrants | Romania | 95.4 /100 | #87 | Exceptional 5.1% |
| Immigrants | Sri Lanka | 94.9 /100 | #88 | Exceptional 5.1% |
| Immigrants | Australia | 94.7 /100 | #89 | Exceptional 5.1% |
| Okinawans | 94.7 /100 | #90 | Exceptional 5.1% |
| Immigrants | Turkey | 94.4 /100 | #91 | Exceptional 5.1% |
| Slavs | 94.2 /100 | #92 | Exceptional 5.1% |
| Immigrants | Serbia | 94.2 /100 | #93 | Exceptional 5.1% |
| Canadians | 94.1 /100 | #94 | Exceptional 5.1% |
Demographics Similar to Tohono O'odham by Male Unemployment
In terms of male unemployment, the demographic groups most similar to Tohono O'odham are Navajo (9.8%, a difference of 3.4%), Alaskan Athabascan (9.8%, a difference of 3.7%), Cheyenne (9.8%, a difference of 3.8%), Crow (10.6%, a difference of 4.4%), and Hopi (10.8%, a difference of 6.1%).
| Demographics | Rating | Rank | Male Unemployment |
| Sioux | 0.0 /100 | #333 | Tragic 8.4% |
| Tsimshian | 0.0 /100 | #334 | Tragic 8.5% |
| Pueblo | 0.0 /100 | #335 | Tragic 8.5% |
| Yuman | 0.0 /100 | #336 | Tragic 8.6% |
| Puerto Ricans | 0.0 /100 | #337 | Tragic 8.6% |
| Apache | 0.0 /100 | #338 | Tragic 8.6% |
| Cheyenne | 0.0 /100 | #339 | Tragic 9.8% |
| Alaskan Athabascans | 0.0 /100 | #340 | Tragic 9.8% |
| Navajo | 0.0 /100 | #341 | Tragic 9.8% |
| Tohono O'odham | 0.0 /100 | #342 | Tragic 10.2% |
| Crow | 0.0 /100 | #343 | Tragic 10.6% |
| Hopi | 0.0 /100 | #344 | Tragic 10.8% |
| Arapaho | 0.0 /100 | #345 | Tragic 11.0% |
| Inupiat | 0.0 /100 | #346 | Tragic 12.1% |
| Yup'ik | 0.0 /100 | #347 | Tragic 16.4% |