Jordanian vs Tohono O'odham Female Poverty
COMPARE
Jordanian
Tohono O'odham
Female Poverty
Female Poverty Comparison
Jordanians
Tohono O'odham
12.3%
FEMALE POVERTY
97.1/ 100
METRIC RATING
82nd/ 347
METRIC RANK
25.9%
FEMALE POVERTY
0.0/ 100
METRIC RATING
347th/ 347
METRIC RANK
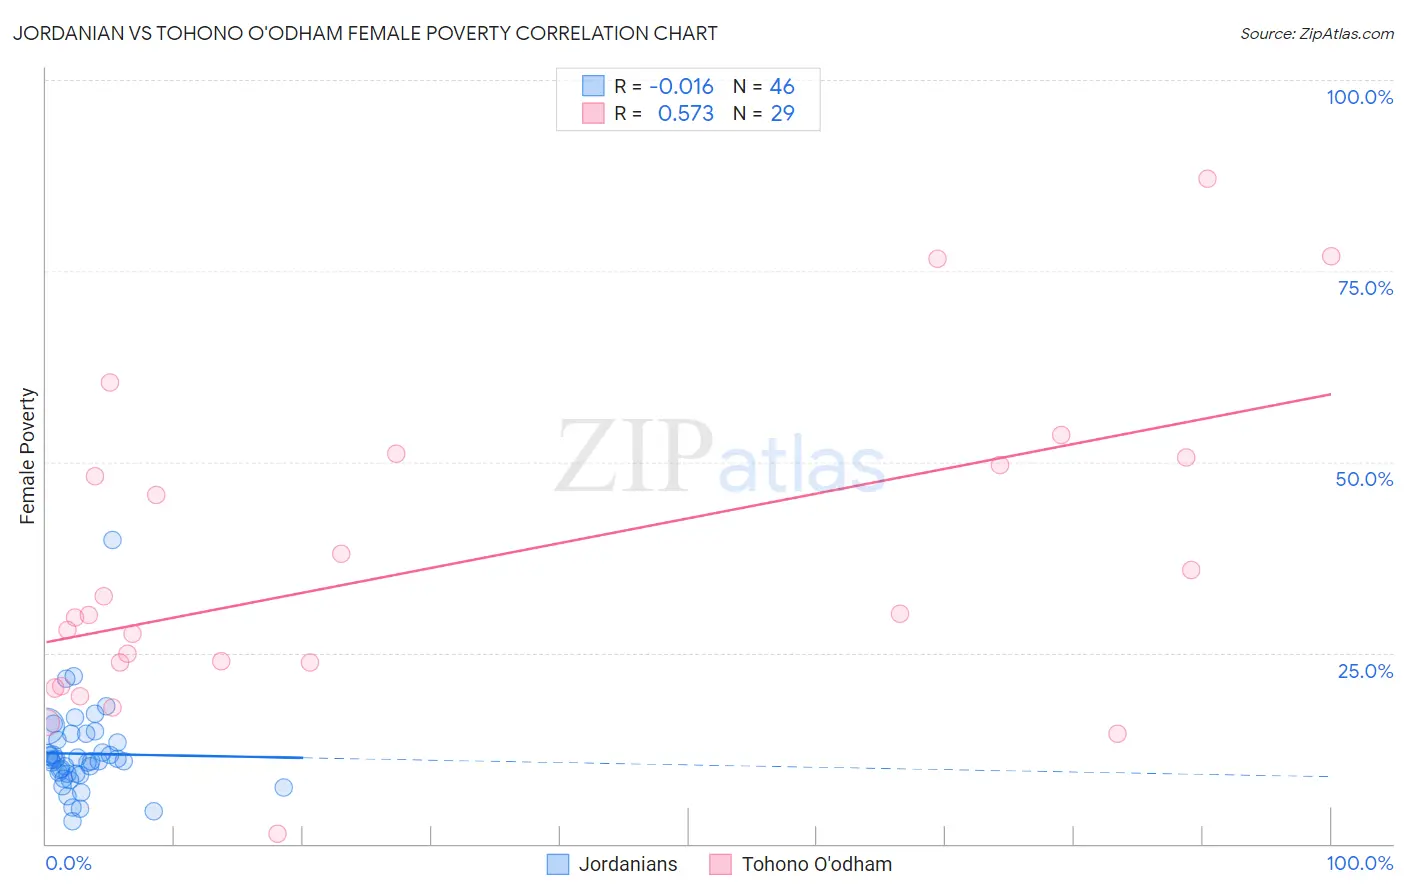
Jordanian vs Tohono O'odham Female Poverty Correlation Chart
The statistical analysis conducted on geographies consisting of 166,392,189 people shows no correlation between the proportion of Jordanians and poverty level among females in the United States with a correlation coefficient (R) of -0.016 and weighted average of 12.3%. Similarly, the statistical analysis conducted on geographies consisting of 58,715,136 people shows a substantial positive correlation between the proportion of Tohono O'odham and poverty level among females in the United States with a correlation coefficient (R) of 0.573 and weighted average of 25.9%, a difference of 110.7%.
Female Poverty Correlation Summary
| Measurement | Jordanian | Tohono O'odham |
| Minimum | 2.9% | 1.4% |
| Maximum | 39.7% | 87.1% |
| Range | 36.8% | 85.7% |
| Mean | 11.8% | 36.5% |
| Median | 10.9% | 30.0% |
| Interquartile 25% (IQ1) | 9.1% | 22.2% |
| Interquartile 75% (IQ3) | 13.6% | 50.0% |
| Interquartile Range (IQR) | 4.5% | 27.9% |
| Standard Deviation (Sample) | 5.8% | 20.4% |
| Standard Deviation (Population) | 5.8% | 20.1% |
Similar Demographics by Female Poverty
Demographics Similar to Jordanians by Female Poverty
In terms of female poverty, the demographic groups most similar to Jordanians are Slovak (12.3%, a difference of 0.010%), Immigrants from Sweden (12.3%, a difference of 0.010%), Immigrants from North America (12.3%, a difference of 0.060%), Egyptian (12.3%, a difference of 0.13%), and Serbian (12.3%, a difference of 0.14%).
| Demographics | Rating | Rank | Female Poverty |
| Europeans | 97.4 /100 | #75 | Exceptional 12.3% |
| Immigrants | Eastern Europe | 97.2 /100 | #76 | Exceptional 12.3% |
| Serbians | 97.2 /100 | #77 | Exceptional 12.3% |
| Egyptians | 97.2 /100 | #78 | Exceptional 12.3% |
| Immigrants | North America | 97.1 /100 | #79 | Exceptional 12.3% |
| Slovaks | 97.1 /100 | #80 | Exceptional 12.3% |
| Immigrants | Sweden | 97.1 /100 | #81 | Exceptional 12.3% |
| Jordanians | 97.1 /100 | #82 | Exceptional 12.3% |
| Immigrants | England | 96.9 /100 | #83 | Exceptional 12.3% |
| Northern Europeans | 96.6 /100 | #84 | Exceptional 12.4% |
| Irish | 96.5 /100 | #85 | Exceptional 12.4% |
| Dutch | 96.5 /100 | #86 | Exceptional 12.4% |
| Okinawans | 96.4 /100 | #87 | Exceptional 12.4% |
| Finns | 96.4 /100 | #88 | Exceptional 12.4% |
| English | 96.1 /100 | #89 | Exceptional 12.4% |
Demographics Similar to Tohono O'odham by Female Poverty
In terms of female poverty, the demographic groups most similar to Tohono O'odham are Puerto Rican (25.2%, a difference of 3.0%), Navajo (23.9%, a difference of 8.6%), Pima (23.6%, a difference of 10.0%), Lumbee (23.5%, a difference of 10.3%), and Immigrants from Yemen (22.8%, a difference of 13.6%).
| Demographics | Rating | Rank | Female Poverty |
| Immigrants | Dominican Republic | 0.0 /100 | #333 | Tragic 19.3% |
| Houma | 0.0 /100 | #334 | Tragic 20.0% |
| Cheyenne | 0.0 /100 | #335 | Tragic 20.2% |
| Pueblo | 0.0 /100 | #336 | Tragic 20.7% |
| Yuman | 0.0 /100 | #337 | Tragic 20.8% |
| Sioux | 0.0 /100 | #338 | Tragic 20.9% |
| Hopi | 0.0 /100 | #339 | Tragic 21.0% |
| Yup'ik | 0.0 /100 | #340 | Tragic 21.5% |
| Crow | 0.0 /100 | #341 | Tragic 22.1% |
| Immigrants | Yemen | 0.0 /100 | #342 | Tragic 22.8% |
| Lumbee | 0.0 /100 | #343 | Tragic 23.5% |
| Pima | 0.0 /100 | #344 | Tragic 23.6% |
| Navajo | 0.0 /100 | #345 | Tragic 23.9% |
| Puerto Ricans | 0.0 /100 | #346 | Tragic 25.2% |
| Tohono O'odham | 0.0 /100 | #347 | Tragic 25.9% |