Bhutanese vs Tohono O'odham Female Poverty

COMPARE

Bhutanese
Race
Ancestry
AfghanAfricanAlaska NativeAlaskan AthabascanAlbanianAleutAlsatianAmericanApacheArabArapahoArgentineanArmenianAssyrian/Chaldean/SyriacAustralianAustrianBahamianBangladeshiBarbadianBasqueBelgianBelizeanBermudanBhutaneseBlackfeetBolivianBrazilianBritishBritish West IndianBulgarianBurmeseCajunCambodianCanadianCape VerdeanCarpatho RusynCelticCentral AmericanCentral American IndianCherokeeCheyenneChickasawChileanChineseChippewaChoctawColombianColvilleComancheCosta RicanCreeCreekCroatianCrowCubanCypriotCzechCzechoslovakianDanishDelawareDominicanDutchDutch West IndianEastern EuropeanEcuadorianEgyptianEnglishEstonianEthiopianEuropeanFijianFilipinoFinnishFrenchFrench American IndianFrench CanadianGermanGerman RussianGhanaianGreekGuamanian/ChamorroGuatemalanGuyaneseHaitianHmongHonduranHopiHoumaHungarianIcelanderIndian (Asian)IndonesianInupiatIranianIraqiIrishIroquoisIsraeliItalianJamaicanJapaneseJordanianKenyanKiowaKoreanLaotianLatvianLebaneseLiberianLithuanianLumbeeLuxembourgerMacedonianMalaysianMalteseMarshalleseMenomineeMexicanMexican American IndianMongolianMoroccanNative HawaiianNavajoNepaleseNew ZealanderNicaraguanNigerianNorthern EuropeanNorwegianOkinawanOsageOttawaPaiutePakistaniPalestinianPanamanianParaguayanPennsylvania GermanPeruvianPimaPolishPortuguesePotawatomiPuebloPuerto RicanPuget Sound SalishRomanianRussianSalvadoranSamoanScandinavianScotch-IrishScottishSeminoleSenegaleseSerbianShoshoneSierra LeoneanSiouxSlavicSlovakSloveneSomaliSouth AfricanSouth AmericanSouth American IndianSoviet UnionSpaniardSpanishSpanish AmericanSpanish American IndianSri LankanSubsaharan AfricanSudaneseSwedishSwissSyrianTaiwaneseThaiTlingit-HaidaTonganTrinidadian and TobagonianTsimshianTurkishU.S. Virgin IslanderUgandanUkrainianUruguayanUteVenezuelanVietnameseWelshWest IndianYakamaYaquiYugoslavianYumanYup'ikZimbabwean
Immigration
NonimmigrantsImmigrantsAfghanistanAfricaAlbaniaArgentinaArmeniaAsiaAustraliaAustriaBahamasBangladeshBarbadosBelarusBelgiumBelizeBoliviaBosnia and HerzegovinaBrazilBulgariaBurma/MyanmarCabo VerdeCambodiaCameroonCanadaCaribbeanCentral AmericaChileChinaColombiaCongoCosta RicaCroatiaCubaCzechoslovakiaDenmarkDominicaDominican RepublicEastern AfricaEastern AsiaEastern EuropeEcuadorEgyptEl SalvadorEnglandEritreaEthiopiaEuropeFijiFranceGermanyGhanaGreeceGrenadaGuatemalaGuyanaHaitiHondurasHong KongHungaryIndiaIndonesiaIranIraqIrelandIsraelItalyJamaicaJapanJordanKazakhstanKenyaKoreaKuwaitLaosLatin AmericaLatviaLebanonLiberiaLithuaniaMalaysiaMexicoMicronesiaMiddle AfricaMoldovaMoroccoNepalNetherlandsNicaraguaNigeriaNorth AmericaNorth MacedoniaNorthern AfricaNorthern EuropeNorwayOceaniaPakistanPanamaPeruPhilippinesPolandPortugalRomaniaRussiaSaudi ArabiaScotlandSenegalSerbiaSierra LeoneSingaporeSomaliaSouth AfricaSouth AmericaSouth Central AsiaSouth Eastern AsiaSouthern EuropeSpainSri LankaSt. Vincent and the GrenadinesSudanSwedenSwitzerlandSyriaTaiwanThailandTrinidad and TobagoTurkeyUgandaUkraineUruguayUzbekistanVenezuelaVietnamWest IndiesWestern AfricaWestern AsiaWestern EuropeYemenZaireZimbabweAzores
Tohono O'odham
Race
Ancestry
AfghanAfricanAlaska NativeAlaskan AthabascanAlbanianAleutAlsatianAmericanApacheArabArapahoArgentineanArmenianAssyrian/Chaldean/SyriacAustralianAustrianBahamianBangladeshiBarbadianBasqueBelgianBelizeanBermudanBlackfeetBolivianBrazilianBritishBritish West IndianBulgarianBurmeseCajunCambodianCanadianCape VerdeanCarpatho RusynCelticCentral AmericanCentral American IndianCherokeeCheyenneChickasawChileanChineseChippewaChoctawColombianColvilleComancheCosta RicanCreeCreekCroatianCrowCubanCypriotCzechCzechoslovakianDanishDelawareDominicanDutchDutch West IndianEastern EuropeanEcuadorianEgyptianEnglishEstonianEthiopianEuropeanFijianFilipinoFinnishFrenchFrench American IndianFrench CanadianGermanGerman RussianGhanaianGreekGuamanian/ChamorroGuatemalanGuyaneseHaitianHmongHonduranHopiHoumaHungarianIcelanderIndian (Asian)IndonesianInupiatIranianIraqiIrishIroquoisIsraeliItalianJamaicanJapaneseJordanianKenyanKiowaKoreanLaotianLatvianLebaneseLiberianLithuanianLumbeeLuxembourgerMacedonianMalaysianMalteseMarshalleseMenomineeMexicanMexican American IndianMongolianMoroccanNative HawaiianNavajoNepaleseNew ZealanderNicaraguanNigerianNorthern EuropeanNorwegianOkinawanOsageOttawaPaiutePakistaniPalestinianPanamanianParaguayanPennsylvania GermanPeruvianPimaPolishPortuguesePotawatomiPuebloPuerto RicanPuget Sound SalishRomanianRussianSalvadoranSamoanScandinavianScotch-IrishScottishSeminoleSenegaleseSerbianShoshoneSierra LeoneanSiouxSlavicSlovakSloveneSomaliSouth AfricanSouth AmericanSouth American IndianSoviet UnionSpaniardSpanishSpanish AmericanSpanish American IndianSri LankanSubsaharan AfricanSudaneseSwedishSwissSyrianTaiwaneseThaiTlingit-HaidaTohono O'OdhamTonganTrinidadian and TobagonianTsimshianTurkishU.S. Virgin IslanderUgandanUkrainianUruguayanUteVenezuelanVietnameseWelshWest IndianYakamaYaquiYugoslavianYumanYup'ikZimbabwean
Immigration
NonimmigrantsImmigrantsAfghanistanAfricaAlbaniaArgentinaArmeniaAsiaAustraliaAustriaBahamasBangladeshBarbadosBelarusBelgiumBelizeBoliviaBosnia and HerzegovinaBrazilBulgariaBurma/MyanmarCabo VerdeCambodiaCameroonCanadaCaribbeanCentral AmericaChileChinaColombiaCongoCosta RicaCroatiaCubaCzechoslovakiaDenmarkDominicaDominican RepublicEastern AfricaEastern AsiaEastern EuropeEcuadorEgyptEl SalvadorEnglandEritreaEthiopiaEuropeFijiFranceGermanyGhanaGreeceGrenadaGuatemalaGuyanaHaitiHondurasHong KongHungaryIndiaIndonesiaIranIraqIrelandIsraelItalyJamaicaJapanJordanKazakhstanKenyaKoreaKuwaitLaosLatin AmericaLatviaLebanonLiberiaLithuaniaMalaysiaMexicoMicronesiaMiddle AfricaMoldovaMoroccoNepalNetherlandsNicaraguaNigeriaNorth AmericaNorth MacedoniaNorthern AfricaNorthern EuropeNorwayOceaniaPakistanPanamaPeruPhilippinesPolandPortugalRomaniaRussiaSaudi ArabiaScotlandSenegalSerbiaSierra LeoneSingaporeSomaliaSouth AfricaSouth AmericaSouth Central AsiaSouth Eastern AsiaSouthern EuropeSpainSri LankaSt. Vincent and the GrenadinesSudanSwedenSwitzerlandSyriaTaiwanThailandTrinidad and TobagoTurkeyUgandaUkraineUruguayUzbekistanVenezuelaVietnamWest IndiesWestern AfricaWestern AsiaWestern EuropeYemenZaireZimbabweAzores
Female Poverty
Income
Poverty
Unemployment
Labor Participation
Family Structure
Vehicle Availability
Education Level
Disability

Female Poverty Comparison

Bhutanese

Tohono O'odham

Exceptional
Tragic
11.3%
FEMALE POVERTY
99.9/ 100
METRIC RATING
12th/ 347
METRIC RANK
25.9%
FEMALE POVERTY
0.0/ 100
METRIC RATING
347th/ 347
METRIC RANK

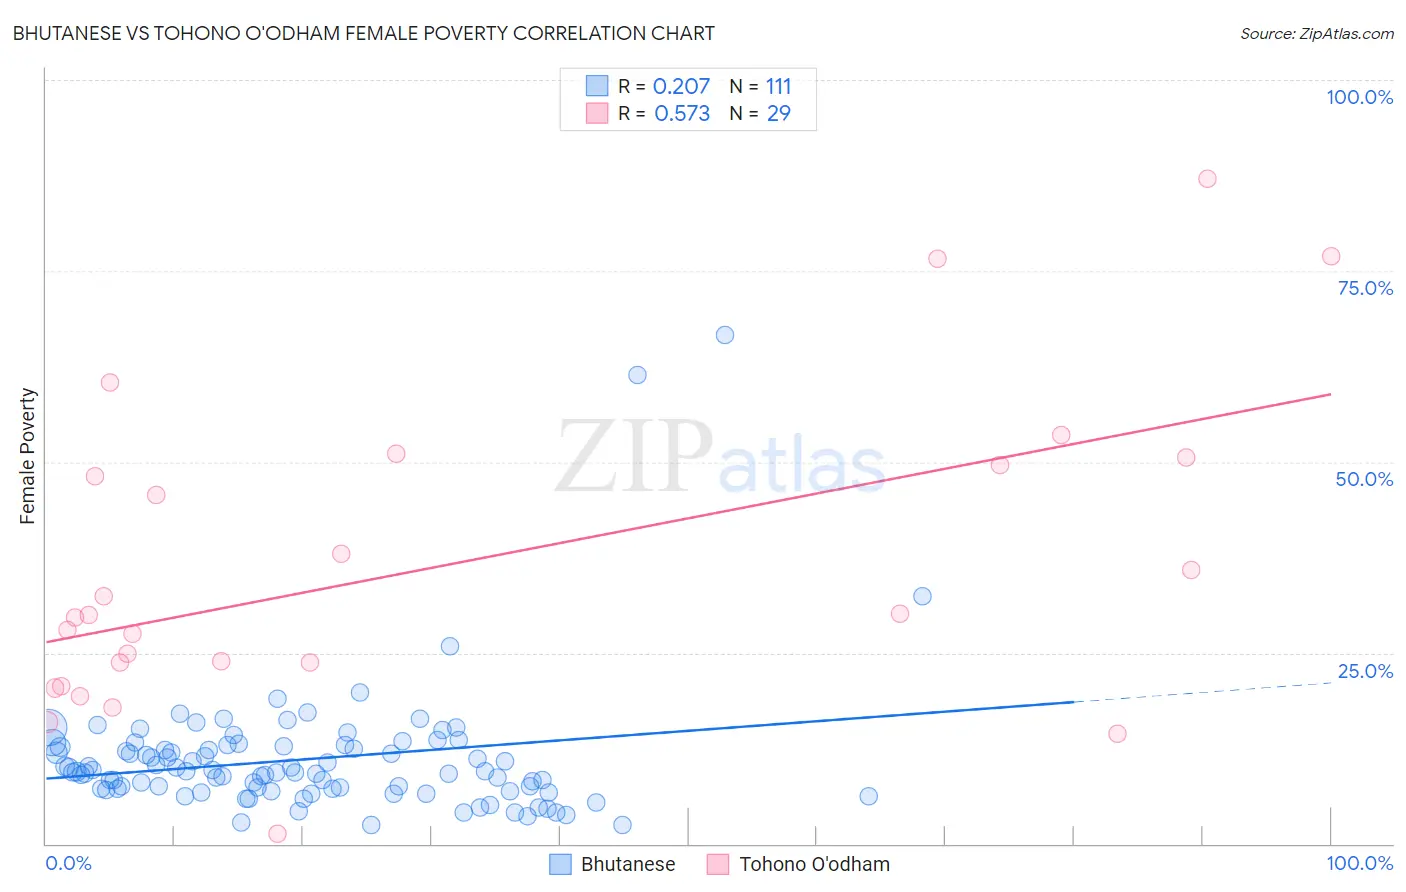
Bhutanese vs Tohono O'odham Female Poverty Correlation Chart

The statistical analysis conducted on geographies consisting of 455,052,143 people shows a weak positive correlation between the proportion of Bhutanese and poverty level among females in the United States with a correlation coefficient (R) of 0.207 and weighted average of 11.3%. Similarly, the statistical analysis conducted on geographies consisting of 58,715,136 people shows a substantial positive correlation between the proportion of Tohono O'odham and poverty level among females in the United States with a correlation coefficient (R) of 0.573 and weighted average of 25.9%, a difference of 129.9%.
Bhutanese vs Tohono O'odham Female Poverty

Female Poverty Correlation Summary

MeasurementBhutaneseTohono O'odham
Minimum2.5%1.4%
Maximum66.7%87.1%
Range64.2%85.7%
Mean11.1%36.5%
Median9.4%30.0%
Interquartile 25% (IQ1)7.2%22.2%
Interquartile 75% (IQ3)12.7%50.0%
Interquartile Range (IQR)5.6%27.9%
Standard Deviation (Sample)8.5%20.4%
Standard Deviation (Population)8.5%20.1%

Similar Demographics by Female Poverty

Demographics Similar to Bhutanese by Female Poverty

In terms of female poverty, the demographic groups most similar to Bhutanese are Immigrants from Lithuania (11.3%, a difference of 0.010%), Maltese (11.2%, a difference of 0.46%), Immigrants from Hong Kong (11.2%, a difference of 0.57%), Lithuanian (11.4%, a difference of 0.97%), and Latvian (11.4%, a difference of 1.3%).
DemographicsRating | RankFemale Poverty
Filipinos
100.0
/100
|
#5
Exceptional
10.9%
Immigrants | Ireland
99.9
/100
|
#6
Exceptional
11.0%
Assyrians/Chaldeans/Syriacs
99.9
/100
|
#7
Exceptional
11.0%
Immigrants | South Central Asia
99.9
/100
|
#8
Exceptional
11.1%
Bulgarians
99.9
/100
|
#9
Exceptional
11.1%
Immigrants | Hong Kong
99.9
/100
|
#10
Exceptional
11.2%
Maltese
99.9
/100
|
#11
Exceptional
11.2%
Bhutanese
99.9
/100
|
#12
Exceptional
11.3%
Immigrants | Lithuania
99.9
/100
|
#13
Exceptional
11.3%
Lithuanians
99.8
/100
|
#14
Exceptional
11.4%
Latvians
99.8
/100
|
#15
Exceptional
11.4%
Immigrants | Bolivia
99.8
/100
|
#16
Exceptional
11.5%
Bolivians
99.8
/100
|
#17
Exceptional
11.5%
Immigrants | Scotland
99.8
/100
|
#18
Exceptional
11.5%
Norwegians
99.8
/100
|
#19
Exceptional
11.5%

Demographics Similar to Tohono O'odham by Female Poverty

In terms of female poverty, the demographic groups most similar to Tohono O'odham are Puerto Rican (25.2%, a difference of 3.0%), Navajo (23.9%, a difference of 8.6%), Pima (23.6%, a difference of 10.0%), Lumbee (23.5%, a difference of 10.3%), and Immigrants from Yemen (22.8%, a difference of 13.6%).
DemographicsRating | RankFemale Poverty
Immigrants | Dominican Republic
0.0
/100
|
#333
Tragic
19.3%
Houma
0.0
/100
|
#334
Tragic
20.0%
Cheyenne
0.0
/100
|
#335
Tragic
20.2%
Pueblo
0.0
/100
|
#336
Tragic
20.7%
Yuman
0.0
/100
|
#337
Tragic
20.8%
Sioux
0.0
/100
|
#338
Tragic
20.9%
Hopi
0.0
/100
|
#339
Tragic
21.0%
Yup'ik
0.0
/100
|
#340
Tragic
21.5%
Crow
0.0
/100
|
#341
Tragic
22.1%
Immigrants | Yemen
0.0
/100
|
#342
Tragic
22.8%
Lumbee
0.0
/100
|
#343
Tragic
23.5%
Pima
0.0
/100
|
#344
Tragic
23.6%
Navajo
0.0
/100
|
#345
Tragic
23.9%
Puerto Ricans
0.0
/100
|
#346
Tragic
25.2%
Tohono O'odham
0.0
/100
|
#347
Tragic
25.9%