Immigrants from Romania vs Pakistani Female Poverty
COMPARE
Immigrants from Romania
Pakistani
Female Poverty
Female Poverty Comparison
Immigrants from Romania
Pakistanis
12.0%
FEMALE POVERTY
99.0/ 100
METRIC RATING
49th/ 347
METRIC RANK
12.9%
FEMALE POVERTY
83.0/ 100
METRIC RATING
140th/ 347
METRIC RANK
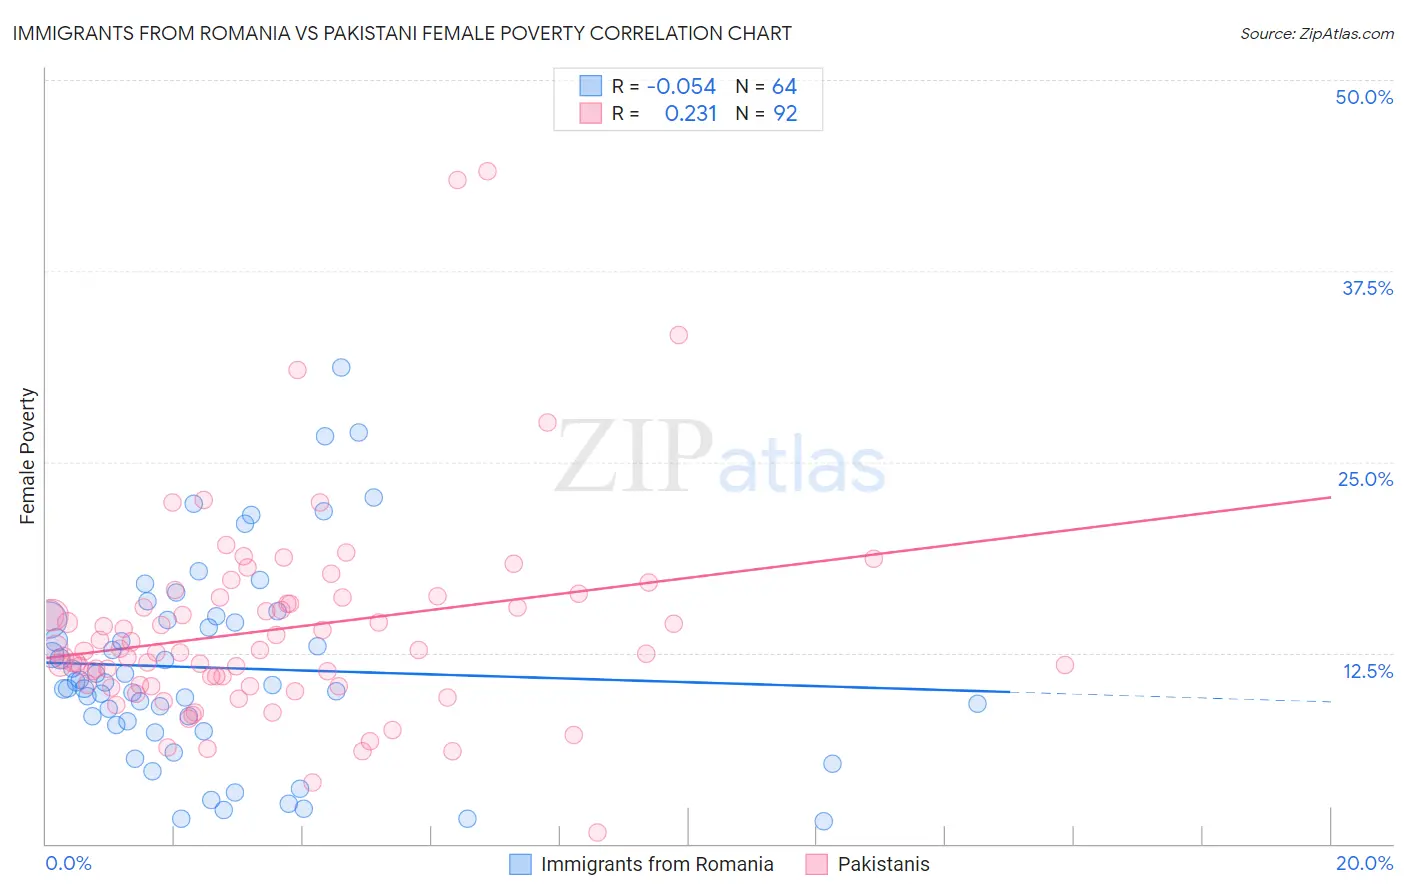
Immigrants from Romania vs Pakistani Female Poverty Correlation Chart
The statistical analysis conducted on geographies consisting of 256,918,121 people shows a slight negative correlation between the proportion of Immigrants from Romania and poverty level among females in the United States with a correlation coefficient (R) of -0.054 and weighted average of 12.0%. Similarly, the statistical analysis conducted on geographies consisting of 335,177,271 people shows a weak positive correlation between the proportion of Pakistanis and poverty level among females in the United States with a correlation coefficient (R) of 0.231 and weighted average of 12.9%, a difference of 8.0%.
Female Poverty Correlation Summary
| Measurement | Immigrants from Romania | Pakistani |
| Minimum | 1.5% | 0.74% |
| Maximum | 31.2% | 44.1% |
| Range | 29.7% | 43.3% |
| Mean | 11.5% | 14.0% |
| Median | 10.5% | 12.7% |
| Interquartile 25% (IQ1) | 7.9% | 10.3% |
| Interquartile 75% (IQ3) | 14.6% | 15.9% |
| Interquartile Range (IQR) | 6.7% | 5.6% |
| Standard Deviation (Sample) | 6.5% | 6.8% |
| Standard Deviation (Population) | 6.4% | 6.7% |
Similar Demographics by Female Poverty
Demographics Similar to Immigrants from Romania by Female Poverty
In terms of female poverty, the demographic groups most similar to Immigrants from Romania are Slovene (12.0%, a difference of 0.010%), Immigrants from Japan (11.9%, a difference of 0.19%), Immigrants from Bulgaria (12.0%, a difference of 0.23%), Asian (11.9%, a difference of 0.42%), and Immigrants from Croatia (12.0%, a difference of 0.54%).
| Demographics | Rating | Rank | Female Poverty |
| Immigrants | Moldova | 99.2 /100 | #42 | Exceptional 11.9% |
| Koreans | 99.2 /100 | #43 | Exceptional 11.9% |
| Tongans | 99.2 /100 | #44 | Exceptional 11.9% |
| Immigrants | Czechoslovakia | 99.2 /100 | #45 | Exceptional 11.9% |
| Turks | 99.2 /100 | #46 | Exceptional 11.9% |
| Asians | 99.1 /100 | #47 | Exceptional 11.9% |
| Immigrants | Japan | 99.0 /100 | #48 | Exceptional 11.9% |
| Immigrants | Romania | 99.0 /100 | #49 | Exceptional 12.0% |
| Slovenes | 98.9 /100 | #50 | Exceptional 12.0% |
| Immigrants | Bulgaria | 98.9 /100 | #51 | Exceptional 12.0% |
| Immigrants | Croatia | 98.7 /100 | #52 | Exceptional 12.0% |
| Immigrants | Austria | 98.7 /100 | #53 | Exceptional 12.0% |
| Immigrants | Philippines | 98.7 /100 | #54 | Exceptional 12.1% |
| Immigrants | Sri Lanka | 98.5 /100 | #55 | Exceptional 12.1% |
| Estonians | 98.3 /100 | #56 | Exceptional 12.1% |
Demographics Similar to Pakistanis by Female Poverty
In terms of female poverty, the demographic groups most similar to Pakistanis are Basque (12.9%, a difference of 0.010%), Immigrants from France (12.9%, a difference of 0.10%), Chilean (12.9%, a difference of 0.32%), Icelander (13.0%, a difference of 0.32%), and Peruvian (12.9%, a difference of 0.41%).
| Demographics | Rating | Rank | Female Poverty |
| Immigrants | Western Europe | 86.6 /100 | #133 | Excellent 12.8% |
| Immigrants | Switzerland | 85.8 /100 | #134 | Excellent 12.9% |
| French | 85.6 /100 | #135 | Excellent 12.9% |
| Peruvians | 85.2 /100 | #136 | Excellent 12.9% |
| Chileans | 84.7 /100 | #137 | Excellent 12.9% |
| Immigrants | France | 83.6 /100 | #138 | Excellent 12.9% |
| Basques | 83.1 /100 | #139 | Excellent 12.9% |
| Pakistanis | 83.0 /100 | #140 | Excellent 12.9% |
| Icelanders | 81.1 /100 | #141 | Excellent 13.0% |
| Brazilians | 80.5 /100 | #142 | Excellent 13.0% |
| Immigrants | Malaysia | 80.4 /100 | #143 | Excellent 13.0% |
| Afghans | 79.8 /100 | #144 | Good 13.0% |
| Syrians | 79.6 /100 | #145 | Good 13.0% |
| Immigrants | Peru | 79.1 /100 | #146 | Good 13.0% |
| Immigrants | Kazakhstan | 78.6 /100 | #147 | Good 13.0% |