Immigrants from Romania vs Alaskan Athabascan Female Poverty
COMPARE
Immigrants from Romania
Alaskan Athabascan
Female Poverty
Female Poverty Comparison
Immigrants from Romania
Alaskan Athabascans
12.0%
FEMALE POVERTY
99.0/ 100
METRIC RATING
49th/ 347
METRIC RANK
14.4%
FEMALE POVERTY
5.3/ 100
METRIC RATING
213th/ 347
METRIC RANK
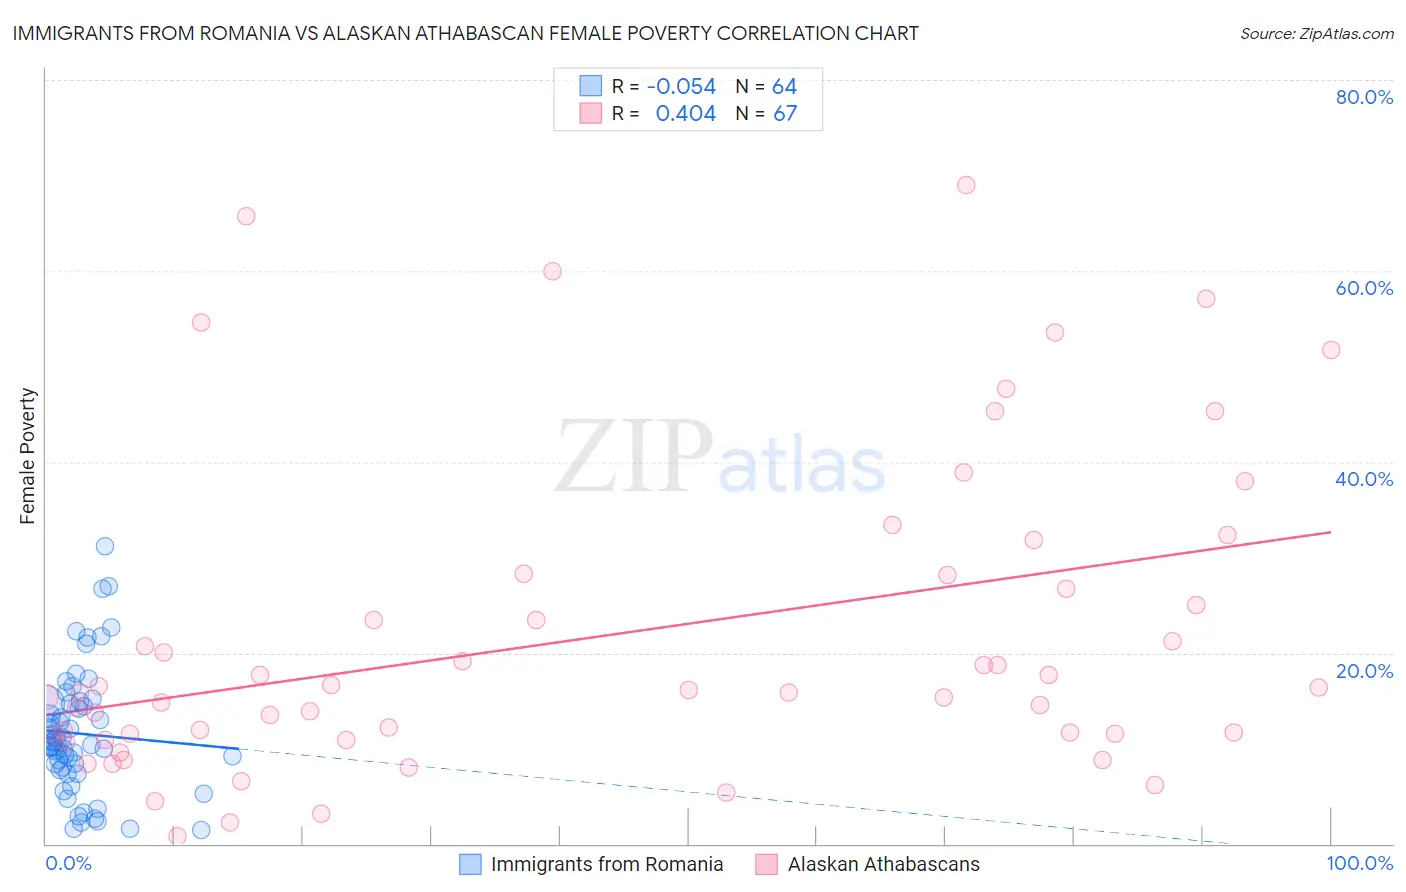
Immigrants from Romania vs Alaskan Athabascan Female Poverty Correlation Chart
The statistical analysis conducted on geographies consisting of 256,918,121 people shows a slight negative correlation between the proportion of Immigrants from Romania and poverty level among females in the United States with a correlation coefficient (R) of -0.054 and weighted average of 12.0%. Similarly, the statistical analysis conducted on geographies consisting of 45,807,044 people shows a moderate positive correlation between the proportion of Alaskan Athabascans and poverty level among females in the United States with a correlation coefficient (R) of 0.404 and weighted average of 14.4%, a difference of 20.1%.
Female Poverty Correlation Summary
| Measurement | Immigrants from Romania | Alaskan Athabascan |
| Minimum | 1.5% | 0.78% |
| Maximum | 31.2% | 69.0% |
| Range | 29.7% | 68.2% |
| Mean | 11.5% | 21.7% |
| Median | 10.5% | 15.9% |
| Interquartile 25% (IQ1) | 7.9% | 11.4% |
| Interquartile 75% (IQ3) | 14.6% | 28.2% |
| Interquartile Range (IQR) | 6.7% | 16.9% |
| Standard Deviation (Sample) | 6.5% | 16.4% |
| Standard Deviation (Population) | 6.4% | 16.3% |
Similar Demographics by Female Poverty
Demographics Similar to Immigrants from Romania by Female Poverty
In terms of female poverty, the demographic groups most similar to Immigrants from Romania are Slovene (12.0%, a difference of 0.010%), Immigrants from Japan (11.9%, a difference of 0.19%), Immigrants from Bulgaria (12.0%, a difference of 0.23%), Asian (11.9%, a difference of 0.42%), and Immigrants from Croatia (12.0%, a difference of 0.54%).
| Demographics | Rating | Rank | Female Poverty |
| Immigrants | Moldova | 99.2 /100 | #42 | Exceptional 11.9% |
| Koreans | 99.2 /100 | #43 | Exceptional 11.9% |
| Tongans | 99.2 /100 | #44 | Exceptional 11.9% |
| Immigrants | Czechoslovakia | 99.2 /100 | #45 | Exceptional 11.9% |
| Turks | 99.2 /100 | #46 | Exceptional 11.9% |
| Asians | 99.1 /100 | #47 | Exceptional 11.9% |
| Immigrants | Japan | 99.0 /100 | #48 | Exceptional 11.9% |
| Immigrants | Romania | 99.0 /100 | #49 | Exceptional 12.0% |
| Slovenes | 98.9 /100 | #50 | Exceptional 12.0% |
| Immigrants | Bulgaria | 98.9 /100 | #51 | Exceptional 12.0% |
| Immigrants | Croatia | 98.7 /100 | #52 | Exceptional 12.0% |
| Immigrants | Austria | 98.7 /100 | #53 | Exceptional 12.0% |
| Immigrants | Philippines | 98.7 /100 | #54 | Exceptional 12.1% |
| Immigrants | Sri Lanka | 98.5 /100 | #55 | Exceptional 12.1% |
| Estonians | 98.3 /100 | #56 | Exceptional 12.1% |
Demographics Similar to Alaskan Athabascans by Female Poverty
In terms of female poverty, the demographic groups most similar to Alaskan Athabascans are Bermudan (14.4%, a difference of 0.080%), Marshallese (14.4%, a difference of 0.16%), Immigrants from Panama (14.4%, a difference of 0.30%), Immigrants from Thailand (14.4%, a difference of 0.39%), and Immigrants (14.4%, a difference of 0.42%).
| Demographics | Rating | Rank | Female Poverty |
| Immigrants | Uruguay | 14.0 /100 | #206 | Poor 14.0% |
| Immigrants | Eastern Africa | 9.0 /100 | #207 | Tragic 14.2% |
| Immigrants | Azores | 7.9 /100 | #208 | Tragic 14.2% |
| Panamanians | 7.7 /100 | #209 | Tragic 14.2% |
| Malaysians | 7.4 /100 | #210 | Tragic 14.3% |
| Moroccans | 7.2 /100 | #211 | Tragic 14.3% |
| Bermudans | 5.5 /100 | #212 | Tragic 14.4% |
| Alaskan Athabascans | 5.3 /100 | #213 | Tragic 14.4% |
| Marshallese | 5.0 /100 | #214 | Tragic 14.4% |
| Immigrants | Panama | 4.7 /100 | #215 | Tragic 14.4% |
| Immigrants | Thailand | 4.5 /100 | #216 | Tragic 14.4% |
| Immigrants | Immigrants | 4.5 /100 | #217 | Tragic 14.4% |
| Immigrants | Uzbekistan | 4.4 /100 | #218 | Tragic 14.4% |
| Japanese | 4.1 /100 | #219 | Tragic 14.5% |
| Alsatians | 4.0 /100 | #220 | Tragic 14.5% |