Cuban vs Tohono O'odham Female Poverty
COMPARE
Cuban
Tohono O'odham
Female Poverty
Female Poverty Comparison
Cubans
Tohono O'odham
15.3%
FEMALE POVERTY
0.3/ 100
METRIC RATING
246th/ 347
METRIC RANK
25.9%
FEMALE POVERTY
0.0/ 100
METRIC RATING
347th/ 347
METRIC RANK
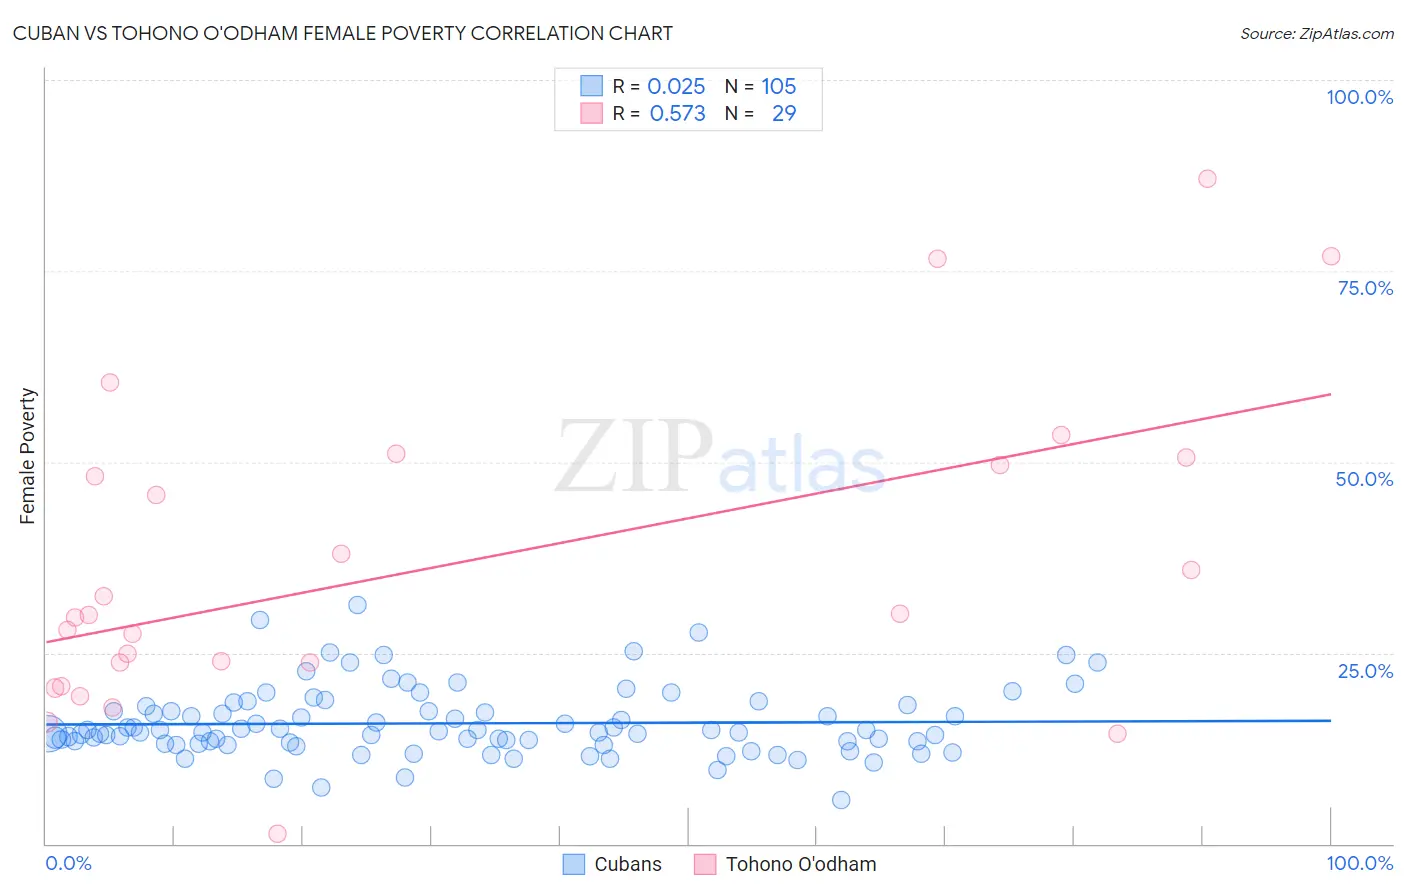
Cuban vs Tohono O'odham Female Poverty Correlation Chart
The statistical analysis conducted on geographies consisting of 448,858,548 people shows no correlation between the proportion of Cubans and poverty level among females in the United States with a correlation coefficient (R) of 0.025 and weighted average of 15.3%. Similarly, the statistical analysis conducted on geographies consisting of 58,715,136 people shows a substantial positive correlation between the proportion of Tohono O'odham and poverty level among females in the United States with a correlation coefficient (R) of 0.573 and weighted average of 25.9%, a difference of 69.5%.
Female Poverty Correlation Summary
| Measurement | Cuban | Tohono O'odham |
| Minimum | 5.8% | 1.4% |
| Maximum | 31.2% | 87.1% |
| Range | 25.5% | 85.7% |
| Mean | 15.8% | 36.5% |
| Median | 14.6% | 30.0% |
| Interquartile 25% (IQ1) | 13.2% | 22.2% |
| Interquartile 75% (IQ3) | 17.7% | 50.0% |
| Interquartile Range (IQR) | 4.5% | 27.9% |
| Standard Deviation (Sample) | 4.5% | 20.4% |
| Standard Deviation (Population) | 4.4% | 20.1% |
Similar Demographics by Female Poverty
Demographics Similar to Cubans by Female Poverty
In terms of female poverty, the demographic groups most similar to Cubans are Potawatomi (15.3%, a difference of 0.010%), Immigrants from Ghana (15.3%, a difference of 0.010%), Spanish American Indian (15.3%, a difference of 0.050%), Ecuadorian (15.3%, a difference of 0.15%), and Salvadoran (15.3%, a difference of 0.15%).
| Demographics | Rating | Rank | Female Poverty |
| Immigrants | Middle Africa | 0.5 /100 | #239 | Tragic 15.2% |
| Sudanese | 0.5 /100 | #240 | Tragic 15.2% |
| Immigrants | Sudan | 0.4 /100 | #241 | Tragic 15.2% |
| Nepalese | 0.4 /100 | #242 | Tragic 15.2% |
| Nicaraguans | 0.3 /100 | #243 | Tragic 15.3% |
| Ecuadorians | 0.3 /100 | #244 | Tragic 15.3% |
| Spanish American Indians | 0.3 /100 | #245 | Tragic 15.3% |
| Cubans | 0.3 /100 | #246 | Tragic 15.3% |
| Potawatomi | 0.3 /100 | #247 | Tragic 15.3% |
| Immigrants | Ghana | 0.3 /100 | #248 | Tragic 15.3% |
| Salvadorans | 0.3 /100 | #249 | Tragic 15.3% |
| Immigrants | Western Africa | 0.3 /100 | #250 | Tragic 15.3% |
| Immigrants | Trinidad and Tobago | 0.3 /100 | #251 | Tragic 15.4% |
| Immigrants | Burma/Myanmar | 0.3 /100 | #252 | Tragic 15.4% |
| Liberians | 0.2 /100 | #253 | Tragic 15.4% |
Demographics Similar to Tohono O'odham by Female Poverty
In terms of female poverty, the demographic groups most similar to Tohono O'odham are Puerto Rican (25.2%, a difference of 3.0%), Navajo (23.9%, a difference of 8.6%), Pima (23.6%, a difference of 10.0%), Lumbee (23.5%, a difference of 10.3%), and Immigrants from Yemen (22.8%, a difference of 13.6%).
| Demographics | Rating | Rank | Female Poverty |
| Immigrants | Dominican Republic | 0.0 /100 | #333 | Tragic 19.3% |
| Houma | 0.0 /100 | #334 | Tragic 20.0% |
| Cheyenne | 0.0 /100 | #335 | Tragic 20.2% |
| Pueblo | 0.0 /100 | #336 | Tragic 20.7% |
| Yuman | 0.0 /100 | #337 | Tragic 20.8% |
| Sioux | 0.0 /100 | #338 | Tragic 20.9% |
| Hopi | 0.0 /100 | #339 | Tragic 21.0% |
| Yup'ik | 0.0 /100 | #340 | Tragic 21.5% |
| Crow | 0.0 /100 | #341 | Tragic 22.1% |
| Immigrants | Yemen | 0.0 /100 | #342 | Tragic 22.8% |
| Lumbee | 0.0 /100 | #343 | Tragic 23.5% |
| Pima | 0.0 /100 | #344 | Tragic 23.6% |
| Navajo | 0.0 /100 | #345 | Tragic 23.9% |
| Puerto Ricans | 0.0 /100 | #346 | Tragic 25.2% |
| Tohono O'odham | 0.0 /100 | #347 | Tragic 25.9% |