Immigrants from Netherlands vs Immigrants from Oceania Divorced or Separated
COMPARE
Immigrants from Netherlands
Immigrants from Oceania
Divorced or Separated
Divorced or Separated Comparison
Immigrants from Netherlands
Immigrants from Oceania
11.9%
DIVORCED OR SEPARATED
83.9/ 100
METRIC RATING
138th/ 347
METRIC RANK
11.9%
DIVORCED OR SEPARATED
77.7/ 100
METRIC RATING
149th/ 347
METRIC RANK
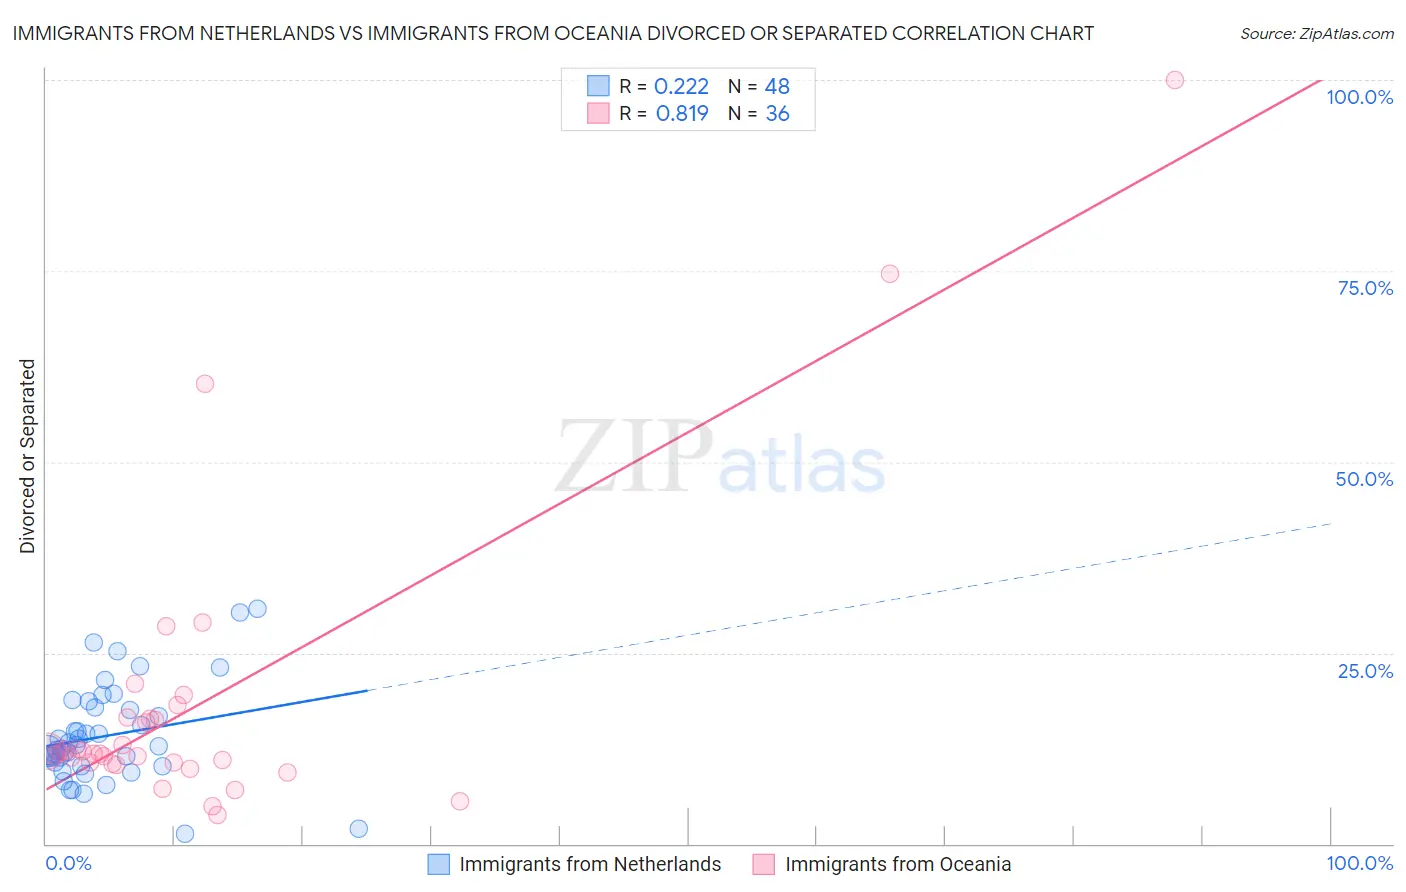
Immigrants from Netherlands vs Immigrants from Oceania Divorced or Separated Correlation Chart
The statistical analysis conducted on geographies consisting of 237,821,691 people shows a weak positive correlation between the proportion of Immigrants from Netherlands and percentage of population currently divorced or separated in the United States with a correlation coefficient (R) of 0.222 and weighted average of 11.9%. Similarly, the statistical analysis conducted on geographies consisting of 305,431,368 people shows a very strong positive correlation between the proportion of Immigrants from Oceania and percentage of population currently divorced or separated in the United States with a correlation coefficient (R) of 0.819 and weighted average of 11.9%, a difference of 0.36%.
Divorced or Separated Correlation Summary
| Measurement | Immigrants from Netherlands | Immigrants from Oceania |
| Minimum | 1.3% | 3.7% |
| Maximum | 30.8% | 100.0% |
| Range | 29.5% | 96.3% |
| Mean | 14.1% | 18.3% |
| Median | 12.6% | 11.9% |
| Interquartile 25% (IQ1) | 10.4% | 10.5% |
| Interquartile 75% (IQ3) | 17.7% | 16.5% |
| Interquartile Range (IQR) | 7.3% | 5.9% |
| Standard Deviation (Sample) | 6.3% | 19.7% |
| Standard Deviation (Population) | 6.3% | 19.4% |
Demographics Similar to Immigrants from Netherlands and Immigrants from Oceania by Divorced or Separated
In terms of divorced or separated, the demographic groups most similar to Immigrants from Netherlands are Alsatian (11.9%, a difference of 0.0%), Australian (11.9%, a difference of 0.020%), Lebanese (11.9%, a difference of 0.030%), Danish (11.9%, a difference of 0.060%), and Carpatho Rusyn (11.9%, a difference of 0.060%). Similarly, the demographic groups most similar to Immigrants from Oceania are Italian (11.9%, a difference of 0.0%), Immigrants from Portugal (11.9%, a difference of 0.020%), Polish (11.9%, a difference of 0.050%), Czech (11.9%, a difference of 0.060%), and Immigrants from Grenada (11.9%, a difference of 0.070%).
| Demographics | Rating | Rank | Divorced or Separated |
| New Zealanders | 87.5 /100 | #133 | Excellent 11.9% |
| Argentineans | 85.1 /100 | #134 | Excellent 11.9% |
| Danes | 84.8 /100 | #135 | Excellent 11.9% |
| Carpatho Rusyns | 84.8 /100 | #136 | Excellent 11.9% |
| Alsatians | 84.0 /100 | #137 | Excellent 11.9% |
| Immigrants | Netherlands | 83.9 /100 | #138 | Excellent 11.9% |
| Australians | 83.6 /100 | #139 | Excellent 11.9% |
| Lebanese | 83.4 /100 | #140 | Excellent 11.9% |
| Immigrants | Morocco | 82.9 /100 | #141 | Excellent 11.9% |
| Immigrants | Zimbabwe | 81.5 /100 | #142 | Excellent 11.9% |
| Pakistanis | 81.3 /100 | #143 | Excellent 11.9% |
| Peruvians | 80.9 /100 | #144 | Excellent 11.9% |
| Croatians | 80.6 /100 | #145 | Excellent 11.9% |
| Immigrants | Grenada | 79.1 /100 | #146 | Good 11.9% |
| Poles | 78.6 /100 | #147 | Good 11.9% |
| Italians | 77.8 /100 | #148 | Good 11.9% |
| Immigrants | Oceania | 77.7 /100 | #149 | Good 11.9% |
| Immigrants | Portugal | 77.3 /100 | #150 | Good 11.9% |
| Czechs | 76.4 /100 | #151 | Good 11.9% |
| Immigrants | Hungary | 73.7 /100 | #152 | Good 11.9% |
| Austrians | 72.2 /100 | #153 | Good 12.0% |