Immigrants from Latvia vs Yugoslavian Female Poverty
COMPARE
Immigrants from Latvia
Yugoslavian
Female Poverty
Female Poverty Comparison
Immigrants from Latvia
Yugoslavians
12.5%
FEMALE POVERTY
94.8/ 100
METRIC RATING
100th/ 347
METRIC RANK
13.1%
FEMALE POVERTY
76.9/ 100
METRIC RATING
148th/ 347
METRIC RANK
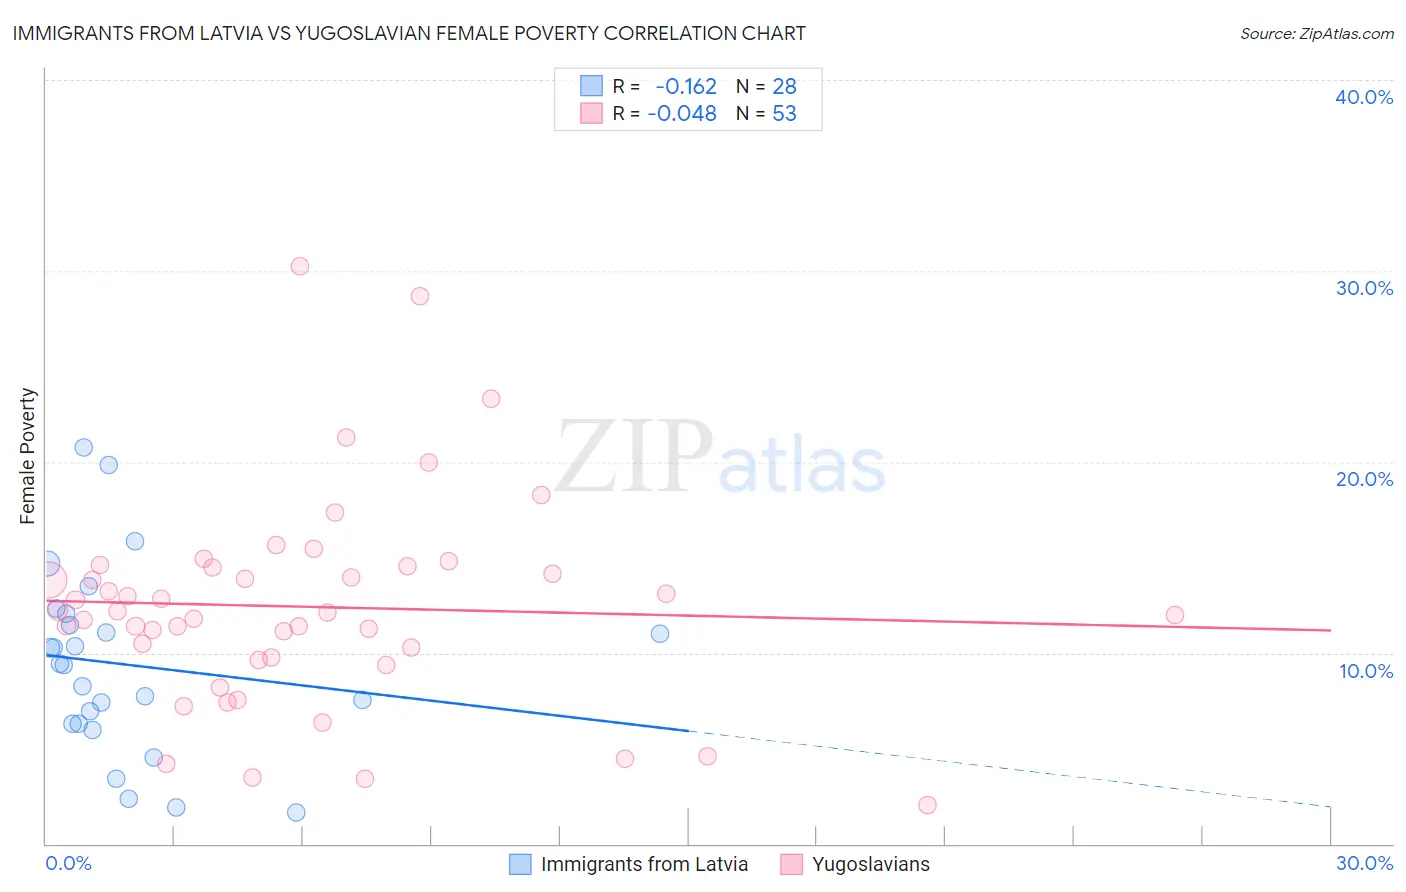
Immigrants from Latvia vs Yugoslavian Female Poverty Correlation Chart
The statistical analysis conducted on geographies consisting of 113,716,282 people shows a poor negative correlation between the proportion of Immigrants from Latvia and poverty level among females in the United States with a correlation coefficient (R) of -0.162 and weighted average of 12.5%. Similarly, the statistical analysis conducted on geographies consisting of 285,591,967 people shows no correlation between the proportion of Yugoslavians and poverty level among females in the United States with a correlation coefficient (R) of -0.048 and weighted average of 13.1%, a difference of 4.4%.
Female Poverty Correlation Summary
| Measurement | Immigrants from Latvia | Yugoslavian |
| Minimum | 1.6% | 2.0% |
| Maximum | 20.7% | 30.2% |
| Range | 19.1% | 28.2% |
| Mean | 9.4% | 12.4% |
| Median | 9.4% | 12.1% |
| Interquartile 25% (IQ1) | 6.3% | 9.7% |
| Interquartile 75% (IQ3) | 11.8% | 14.5% |
| Interquartile Range (IQR) | 5.5% | 4.8% |
| Standard Deviation (Sample) | 4.8% | 5.5% |
| Standard Deviation (Population) | 4.7% | 5.5% |
Similar Demographics by Female Poverty
Demographics Similar to Immigrants from Latvia by Female Poverty
In terms of female poverty, the demographic groups most similar to Immigrants from Latvia are Tlingit-Haida (12.5%, a difference of 0.0%), Romanian (12.5%, a difference of 0.15%), Immigrants from China (12.5%, a difference of 0.15%), Native Hawaiian (12.5%, a difference of 0.17%), and Slavic (12.5%, a difference of 0.17%).
| Demographics | Rating | Rank | Female Poverty |
| Immigrants | Egypt | 95.5 /100 | #93 | Exceptional 12.5% |
| Immigrants | Indonesia | 95.4 /100 | #94 | Exceptional 12.5% |
| Immigrants | South Africa | 95.4 /100 | #95 | Exceptional 12.5% |
| British | 95.2 /100 | #96 | Exceptional 12.5% |
| Australians | 95.2 /100 | #97 | Exceptional 12.5% |
| Native Hawaiians | 95.1 /100 | #98 | Exceptional 12.5% |
| Romanians | 95.1 /100 | #99 | Exceptional 12.5% |
| Immigrants | Latvia | 94.8 /100 | #100 | Exceptional 12.5% |
| Tlingit-Haida | 94.8 /100 | #101 | Exceptional 12.5% |
| Immigrants | China | 94.5 /100 | #102 | Exceptional 12.5% |
| Slavs | 94.5 /100 | #103 | Exceptional 12.5% |
| Palestinians | 94.3 /100 | #104 | Exceptional 12.5% |
| Scottish | 94.1 /100 | #105 | Exceptional 12.5% |
| Immigrants | Turkey | 93.8 /100 | #106 | Exceptional 12.6% |
| Laotians | 93.4 /100 | #107 | Exceptional 12.6% |
Demographics Similar to Yugoslavians by Female Poverty
In terms of female poverty, the demographic groups most similar to Yugoslavians are Taiwanese (13.1%, a difference of 0.16%), Tsimshian (13.1%, a difference of 0.19%), Immigrants from Kazakhstan (13.0%, a difference of 0.25%), Immigrants from Germany (13.1%, a difference of 0.26%), and Immigrants from Peru (13.0%, a difference of 0.33%).
| Demographics | Rating | Rank | Female Poverty |
| Icelanders | 81.1 /100 | #141 | Excellent 13.0% |
| Brazilians | 80.5 /100 | #142 | Excellent 13.0% |
| Immigrants | Malaysia | 80.4 /100 | #143 | Excellent 13.0% |
| Afghans | 79.8 /100 | #144 | Good 13.0% |
| Syrians | 79.6 /100 | #145 | Good 13.0% |
| Immigrants | Peru | 79.1 /100 | #146 | Good 13.0% |
| Immigrants | Kazakhstan | 78.6 /100 | #147 | Good 13.0% |
| Yugoslavians | 76.9 /100 | #148 | Good 13.1% |
| Taiwanese | 75.7 /100 | #149 | Good 13.1% |
| Tsimshian | 75.5 /100 | #150 | Good 13.1% |
| Immigrants | Germany | 74.9 /100 | #151 | Good 13.1% |
| Samoans | 73.6 /100 | #152 | Good 13.1% |
| Immigrants | Fiji | 71.0 /100 | #153 | Good 13.2% |
| Armenians | 70.4 /100 | #154 | Good 13.2% |
| Hungarians | 70.1 /100 | #155 | Good 13.2% |