Immigrants from Latvia vs Immigrants from Nepal Female Poverty
COMPARE
Immigrants from Latvia
Immigrants from Nepal
Female Poverty
Female Poverty Comparison
Immigrants from Latvia
Immigrants from Nepal
12.5%
FEMALE POVERTY
94.8/ 100
METRIC RATING
100th/ 347
METRIC RANK
13.3%
FEMALE POVERTY
62.7/ 100
METRIC RATING
160th/ 347
METRIC RANK
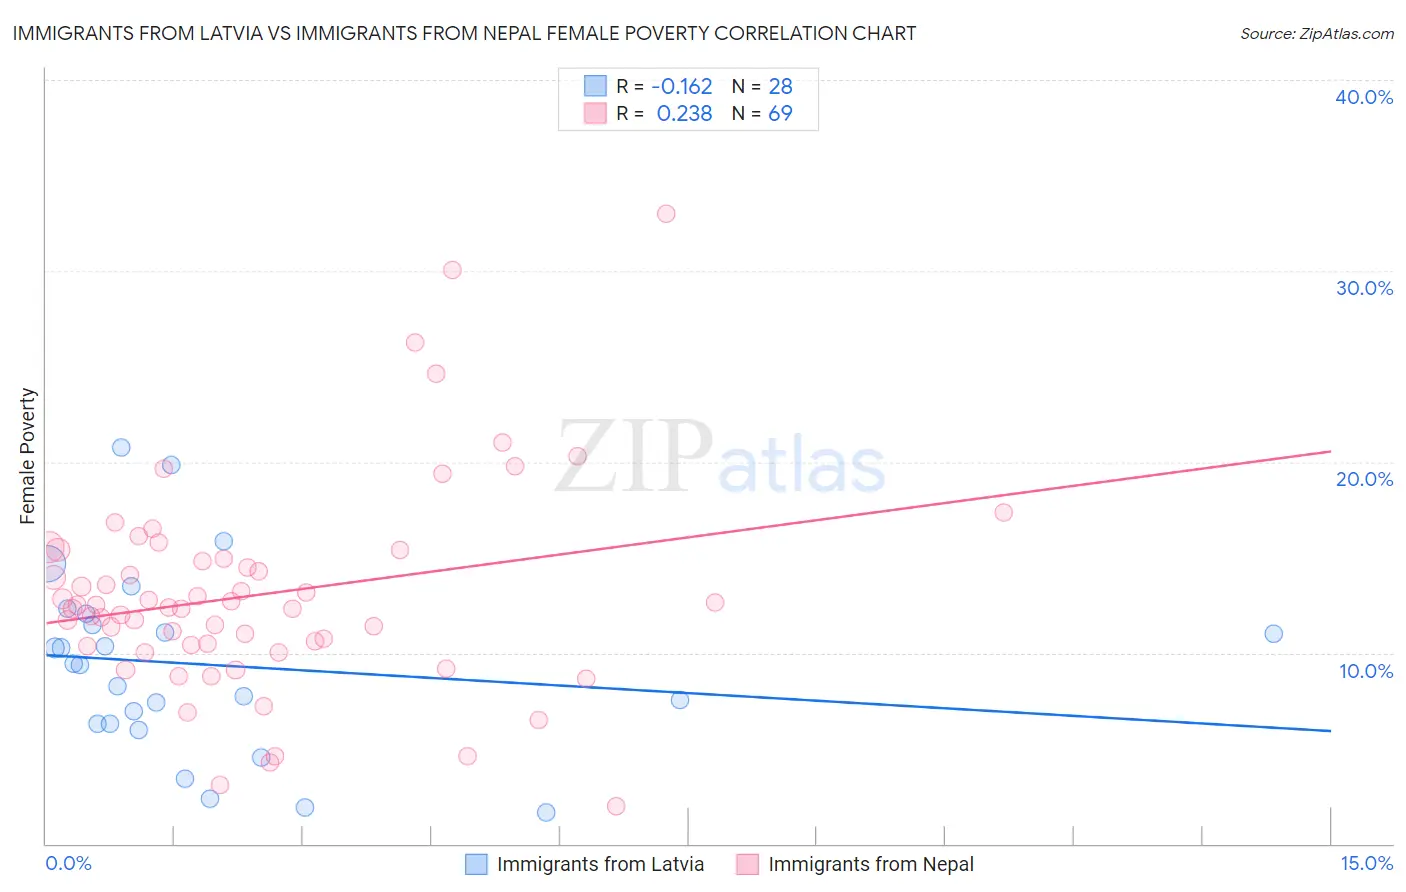
Immigrants from Latvia vs Immigrants from Nepal Female Poverty Correlation Chart
The statistical analysis conducted on geographies consisting of 113,716,282 people shows a poor negative correlation between the proportion of Immigrants from Latvia and poverty level among females in the United States with a correlation coefficient (R) of -0.162 and weighted average of 12.5%. Similarly, the statistical analysis conducted on geographies consisting of 186,688,907 people shows a weak positive correlation between the proportion of Immigrants from Nepal and poverty level among females in the United States with a correlation coefficient (R) of 0.238 and weighted average of 13.3%, a difference of 6.2%.
Female Poverty Correlation Summary
| Measurement | Immigrants from Latvia | Immigrants from Nepal |
| Minimum | 1.6% | 2.0% |
| Maximum | 20.7% | 33.0% |
| Range | 19.1% | 31.0% |
| Mean | 9.4% | 13.1% |
| Median | 9.4% | 12.4% |
| Interquartile 25% (IQ1) | 6.3% | 10.4% |
| Interquartile 75% (IQ3) | 11.8% | 15.2% |
| Interquartile Range (IQR) | 5.5% | 4.8% |
| Standard Deviation (Sample) | 4.8% | 5.5% |
| Standard Deviation (Population) | 4.7% | 5.5% |
Similar Demographics by Female Poverty
Demographics Similar to Immigrants from Latvia by Female Poverty
In terms of female poverty, the demographic groups most similar to Immigrants from Latvia are Tlingit-Haida (12.5%, a difference of 0.0%), Romanian (12.5%, a difference of 0.15%), Immigrants from China (12.5%, a difference of 0.15%), Native Hawaiian (12.5%, a difference of 0.17%), and Slavic (12.5%, a difference of 0.17%).
| Demographics | Rating | Rank | Female Poverty |
| Immigrants | Egypt | 95.5 /100 | #93 | Exceptional 12.5% |
| Immigrants | Indonesia | 95.4 /100 | #94 | Exceptional 12.5% |
| Immigrants | South Africa | 95.4 /100 | #95 | Exceptional 12.5% |
| British | 95.2 /100 | #96 | Exceptional 12.5% |
| Australians | 95.2 /100 | #97 | Exceptional 12.5% |
| Native Hawaiians | 95.1 /100 | #98 | Exceptional 12.5% |
| Romanians | 95.1 /100 | #99 | Exceptional 12.5% |
| Immigrants | Latvia | 94.8 /100 | #100 | Exceptional 12.5% |
| Tlingit-Haida | 94.8 /100 | #101 | Exceptional 12.5% |
| Immigrants | China | 94.5 /100 | #102 | Exceptional 12.5% |
| Slavs | 94.5 /100 | #103 | Exceptional 12.5% |
| Palestinians | 94.3 /100 | #104 | Exceptional 12.5% |
| Scottish | 94.1 /100 | #105 | Exceptional 12.5% |
| Immigrants | Turkey | 93.8 /100 | #106 | Exceptional 12.6% |
| Laotians | 93.4 /100 | #107 | Exceptional 12.6% |
Demographics Similar to Immigrants from Nepal by Female Poverty
In terms of female poverty, the demographic groups most similar to Immigrants from Nepal are Immigrants from Ethiopia (13.3%, a difference of 0.030%), Guamanian/Chamorro (13.3%, a difference of 0.030%), Immigrants from Albania (13.3%, a difference of 0.040%), Ethiopian (13.3%, a difference of 0.050%), and Scotch-Irish (13.3%, a difference of 0.070%).
| Demographics | Rating | Rank | Female Poverty |
| Immigrants | Fiji | 71.0 /100 | #153 | Good 13.2% |
| Armenians | 70.4 /100 | #154 | Good 13.2% |
| Hungarians | 70.1 /100 | #155 | Good 13.2% |
| Immigrants | Bosnia and Herzegovina | 69.7 /100 | #156 | Good 13.2% |
| Immigrants | Northern Africa | 68.8 /100 | #157 | Good 13.2% |
| Pennsylvania Germans | 67.3 /100 | #158 | Good 13.2% |
| Costa Ricans | 63.6 /100 | #159 | Good 13.3% |
| Immigrants | Nepal | 62.7 /100 | #160 | Good 13.3% |
| Immigrants | Ethiopia | 62.5 /100 | #161 | Good 13.3% |
| Guamanians/Chamorros | 62.4 /100 | #162 | Good 13.3% |
| Immigrants | Albania | 62.4 /100 | #163 | Good 13.3% |
| Ethiopians | 62.3 /100 | #164 | Good 13.3% |
| Scotch-Irish | 62.1 /100 | #165 | Good 13.3% |
| Immigrants | Oceania | 59.7 /100 | #166 | Average 13.3% |
| Immigrants | Chile | 57.4 /100 | #167 | Average 13.3% |