Immigrants from Latvia vs Immigrants from Turkey Female Poverty
COMPARE
Immigrants from Latvia
Immigrants from Turkey
Female Poverty
Female Poverty Comparison
Immigrants from Latvia
Immigrants from Turkey
12.5%
FEMALE POVERTY
94.8/ 100
METRIC RATING
100th/ 347
METRIC RANK
12.6%
FEMALE POVERTY
93.8/ 100
METRIC RATING
106th/ 347
METRIC RANK
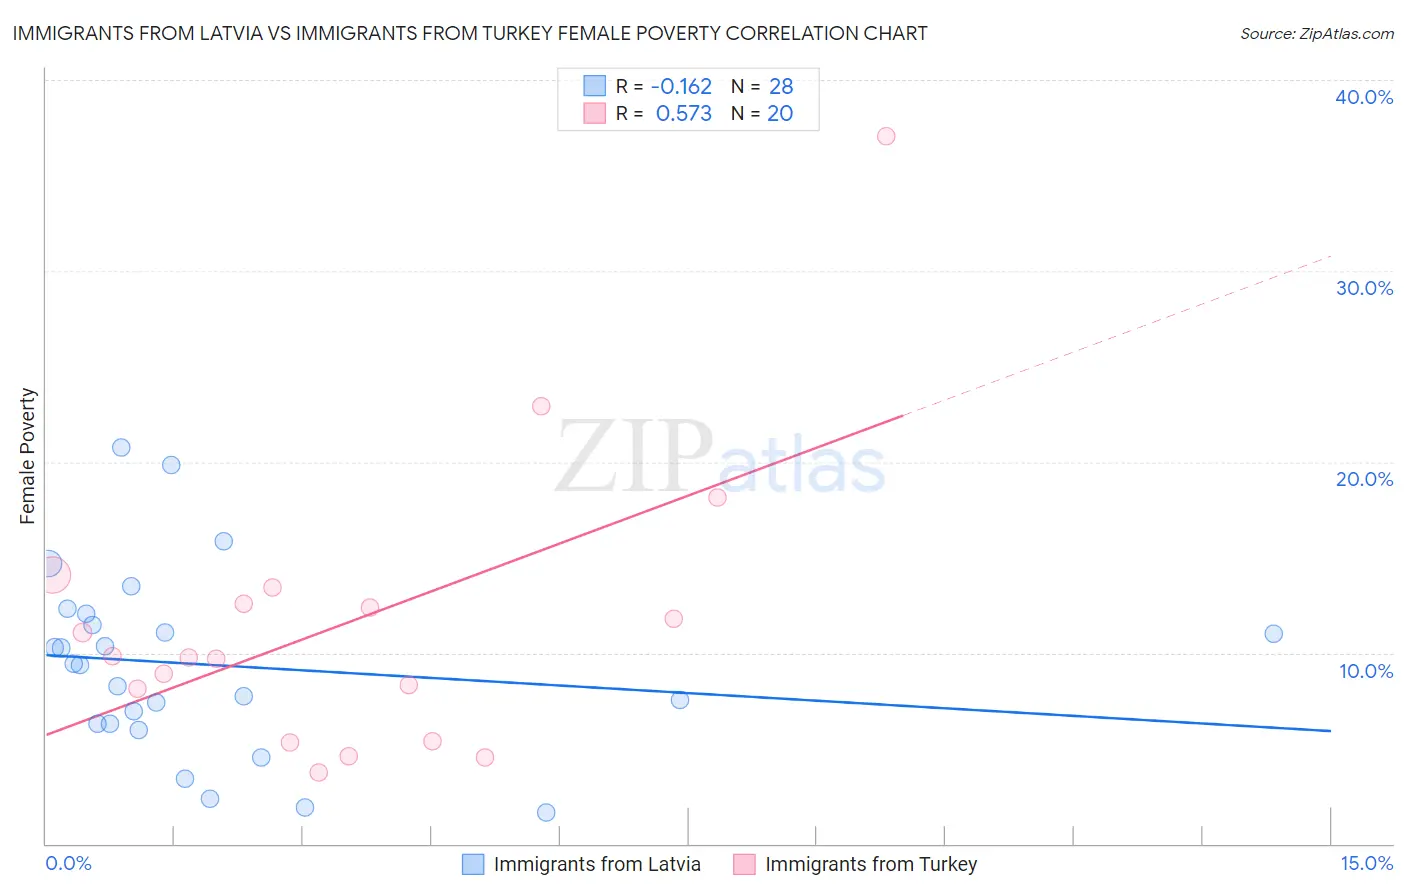
Immigrants from Latvia vs Immigrants from Turkey Female Poverty Correlation Chart
The statistical analysis conducted on geographies consisting of 113,716,282 people shows a poor negative correlation between the proportion of Immigrants from Latvia and poverty level among females in the United States with a correlation coefficient (R) of -0.162 and weighted average of 12.5%. Similarly, the statistical analysis conducted on geographies consisting of 222,940,623 people shows a substantial positive correlation between the proportion of Immigrants from Turkey and poverty level among females in the United States with a correlation coefficient (R) of 0.573 and weighted average of 12.6%, a difference of 0.49%.
Female Poverty Correlation Summary
| Measurement | Immigrants from Latvia | Immigrants from Turkey |
| Minimum | 1.6% | 3.7% |
| Maximum | 20.7% | 37.0% |
| Range | 19.1% | 33.3% |
| Mean | 9.4% | 11.6% |
| Median | 9.4% | 9.8% |
| Interquartile 25% (IQ1) | 6.3% | 6.7% |
| Interquartile 75% (IQ3) | 11.8% | 13.0% |
| Interquartile Range (IQR) | 5.5% | 6.2% |
| Standard Deviation (Sample) | 4.8% | 7.6% |
| Standard Deviation (Population) | 4.7% | 7.4% |
Demographics Similar to Immigrants from Latvia and Immigrants from Turkey by Female Poverty
In terms of female poverty, the demographic groups most similar to Immigrants from Latvia are Tlingit-Haida (12.5%, a difference of 0.0%), Romanian (12.5%, a difference of 0.15%), Immigrants from China (12.5%, a difference of 0.15%), Native Hawaiian (12.5%, a difference of 0.17%), and Slavic (12.5%, a difference of 0.17%). Similarly, the demographic groups most similar to Immigrants from Turkey are Scottish (12.5%, a difference of 0.12%), Laotian (12.6%, a difference of 0.19%), Palestinian (12.5%, a difference of 0.23%), Portuguese (12.6%, a difference of 0.29%), and Immigrants from Zimbabwe (12.6%, a difference of 0.31%).
| Demographics | Rating | Rank | Female Poverty |
| Immigrants | Egypt | 95.5 /100 | #93 | Exceptional 12.5% |
| Immigrants | Indonesia | 95.4 /100 | #94 | Exceptional 12.5% |
| Immigrants | South Africa | 95.4 /100 | #95 | Exceptional 12.5% |
| British | 95.2 /100 | #96 | Exceptional 12.5% |
| Australians | 95.2 /100 | #97 | Exceptional 12.5% |
| Native Hawaiians | 95.1 /100 | #98 | Exceptional 12.5% |
| Romanians | 95.1 /100 | #99 | Exceptional 12.5% |
| Immigrants | Latvia | 94.8 /100 | #100 | Exceptional 12.5% |
| Tlingit-Haida | 94.8 /100 | #101 | Exceptional 12.5% |
| Immigrants | China | 94.5 /100 | #102 | Exceptional 12.5% |
| Slavs | 94.5 /100 | #103 | Exceptional 12.5% |
| Palestinians | 94.3 /100 | #104 | Exceptional 12.5% |
| Scottish | 94.1 /100 | #105 | Exceptional 12.5% |
| Immigrants | Turkey | 93.8 /100 | #106 | Exceptional 12.6% |
| Laotians | 93.4 /100 | #107 | Exceptional 12.6% |
| Portuguese | 93.1 /100 | #108 | Exceptional 12.6% |
| Immigrants | Zimbabwe | 93.1 /100 | #109 | Exceptional 12.6% |
| Paraguayans | 93.0 /100 | #110 | Exceptional 12.6% |
| Soviet Union | 92.4 /100 | #111 | Exceptional 12.6% |
| Immigrants | Israel | 92.0 /100 | #112 | Exceptional 12.6% |
| Canadians | 92.0 /100 | #113 | Exceptional 12.7% |