Immigrants from Latvia vs Immigrants from Afghanistan Female Poverty
COMPARE
Immigrants from Latvia
Immigrants from Afghanistan
Female Poverty
Female Poverty Comparison
Immigrants from Latvia
Immigrants from Afghanistan
12.5%
FEMALE POVERTY
94.8/ 100
METRIC RATING
100th/ 347
METRIC RANK
13.4%
FEMALE POVERTY
50.8/ 100
METRIC RATING
173rd/ 347
METRIC RANK
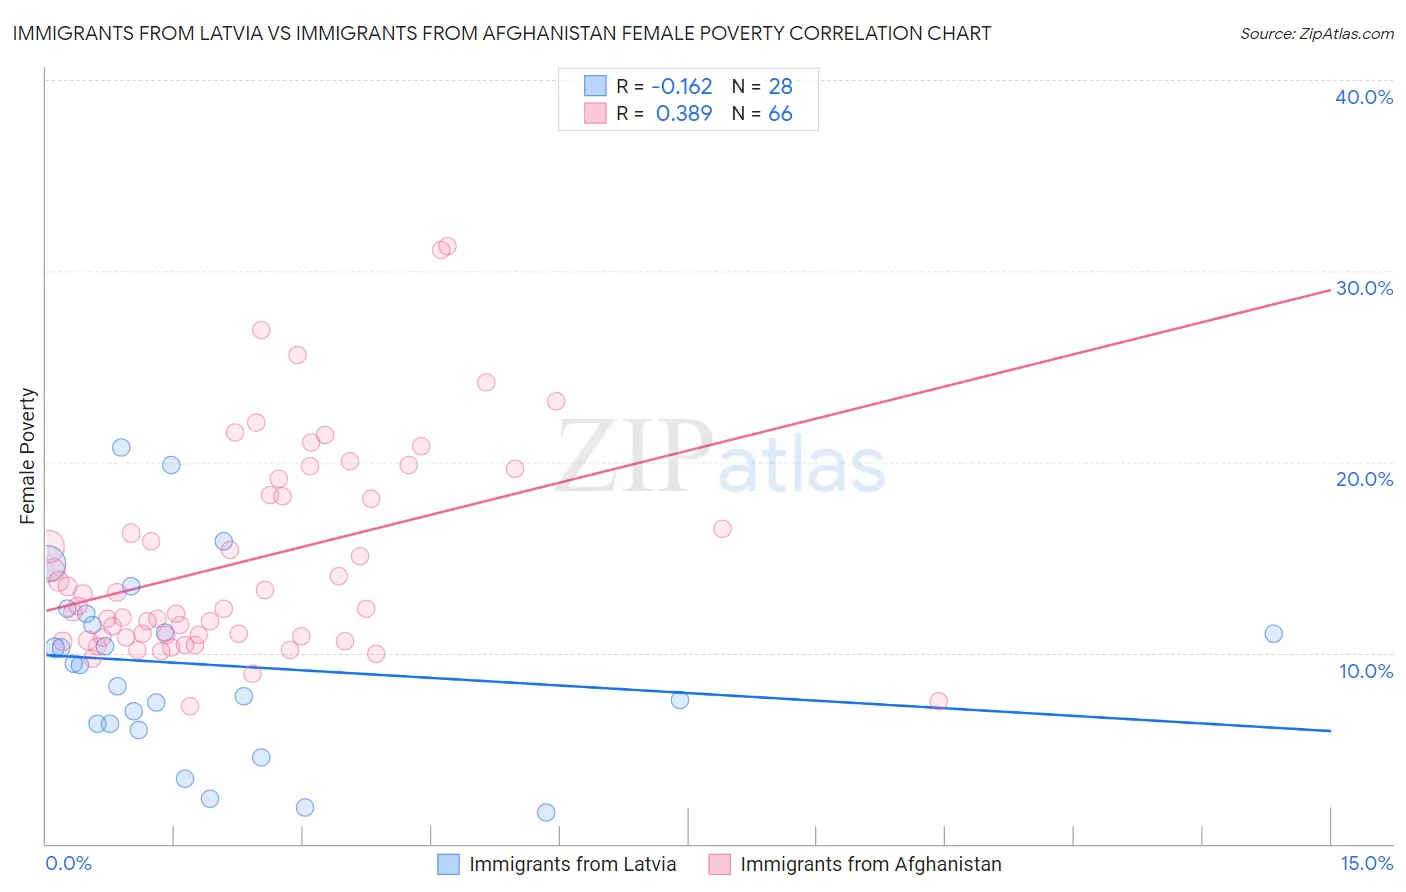
Immigrants from Latvia vs Immigrants from Afghanistan Female Poverty Correlation Chart
The statistical analysis conducted on geographies consisting of 113,716,282 people shows a poor negative correlation between the proportion of Immigrants from Latvia and poverty level among females in the United States with a correlation coefficient (R) of -0.162 and weighted average of 12.5%. Similarly, the statistical analysis conducted on geographies consisting of 147,630,543 people shows a mild positive correlation between the proportion of Immigrants from Afghanistan and poverty level among females in the United States with a correlation coefficient (R) of 0.389 and weighted average of 13.4%, a difference of 7.4%.
Female Poverty Correlation Summary
| Measurement | Immigrants from Latvia | Immigrants from Afghanistan |
| Minimum | 1.6% | 7.2% |
| Maximum | 20.7% | 31.3% |
| Range | 19.1% | 24.1% |
| Mean | 9.4% | 14.8% |
| Median | 9.4% | 12.4% |
| Interquartile 25% (IQ1) | 6.3% | 10.8% |
| Interquartile 75% (IQ3) | 11.8% | 18.2% |
| Interquartile Range (IQR) | 5.5% | 7.4% |
| Standard Deviation (Sample) | 4.8% | 5.5% |
| Standard Deviation (Population) | 4.7% | 5.4% |
Similar Demographics by Female Poverty
Demographics Similar to Immigrants from Latvia by Female Poverty
In terms of female poverty, the demographic groups most similar to Immigrants from Latvia are Tlingit-Haida (12.5%, a difference of 0.0%), Romanian (12.5%, a difference of 0.15%), Immigrants from China (12.5%, a difference of 0.15%), Native Hawaiian (12.5%, a difference of 0.17%), and Slavic (12.5%, a difference of 0.17%).
| Demographics | Rating | Rank | Female Poverty |
| Immigrants | Egypt | 95.5 /100 | #93 | Exceptional 12.5% |
| Immigrants | Indonesia | 95.4 /100 | #94 | Exceptional 12.5% |
| Immigrants | South Africa | 95.4 /100 | #95 | Exceptional 12.5% |
| British | 95.2 /100 | #96 | Exceptional 12.5% |
| Australians | 95.2 /100 | #97 | Exceptional 12.5% |
| Native Hawaiians | 95.1 /100 | #98 | Exceptional 12.5% |
| Romanians | 95.1 /100 | #99 | Exceptional 12.5% |
| Immigrants | Latvia | 94.8 /100 | #100 | Exceptional 12.5% |
| Tlingit-Haida | 94.8 /100 | #101 | Exceptional 12.5% |
| Immigrants | China | 94.5 /100 | #102 | Exceptional 12.5% |
| Slavs | 94.5 /100 | #103 | Exceptional 12.5% |
| Palestinians | 94.3 /100 | #104 | Exceptional 12.5% |
| Scottish | 94.1 /100 | #105 | Exceptional 12.5% |
| Immigrants | Turkey | 93.8 /100 | #106 | Exceptional 12.6% |
| Laotians | 93.4 /100 | #107 | Exceptional 12.6% |
Demographics Similar to Immigrants from Afghanistan by Female Poverty
In terms of female poverty, the demographic groups most similar to Immigrants from Afghanistan are Immigrants from Iraq (13.4%, a difference of 0.070%), Celtic (13.4%, a difference of 0.080%), Immigrants from Spain (13.4%, a difference of 0.090%), Immigrants from Morocco (13.4%, a difference of 0.13%), and Israeli (13.5%, a difference of 0.16%).
| Demographics | Rating | Rank | Female Poverty |
| Immigrants | Oceania | 59.7 /100 | #166 | Average 13.3% |
| Immigrants | Chile | 57.4 /100 | #167 | Average 13.3% |
| Aleuts | 56.7 /100 | #168 | Average 13.4% |
| Lebanese | 55.9 /100 | #169 | Average 13.4% |
| Colombians | 55.7 /100 | #170 | Average 13.4% |
| Whites/Caucasians | 54.6 /100 | #171 | Average 13.4% |
| Mongolians | 53.6 /100 | #172 | Average 13.4% |
| Immigrants | Afghanistan | 50.8 /100 | #173 | Average 13.4% |
| Immigrants | Iraq | 50.0 /100 | #174 | Average 13.4% |
| Celtics | 49.9 /100 | #175 | Average 13.4% |
| Immigrants | Spain | 49.9 /100 | #176 | Average 13.4% |
| Immigrants | Morocco | 49.4 /100 | #177 | Average 13.4% |
| Israelis | 49.1 /100 | #178 | Average 13.5% |
| Immigrants | Syria | 48.8 /100 | #179 | Average 13.5% |
| South Americans | 44.8 /100 | #180 | Average 13.5% |