Immigrants from Latvia vs Shoshone Female Poverty
COMPARE
Immigrants from Latvia
Shoshone
Female Poverty
Female Poverty Comparison
Immigrants from Latvia
Shoshone
12.5%
FEMALE POVERTY
94.8/ 100
METRIC RATING
100th/ 347
METRIC RANK
15.6%
FEMALE POVERTY
0.1/ 100
METRIC RATING
258th/ 347
METRIC RANK
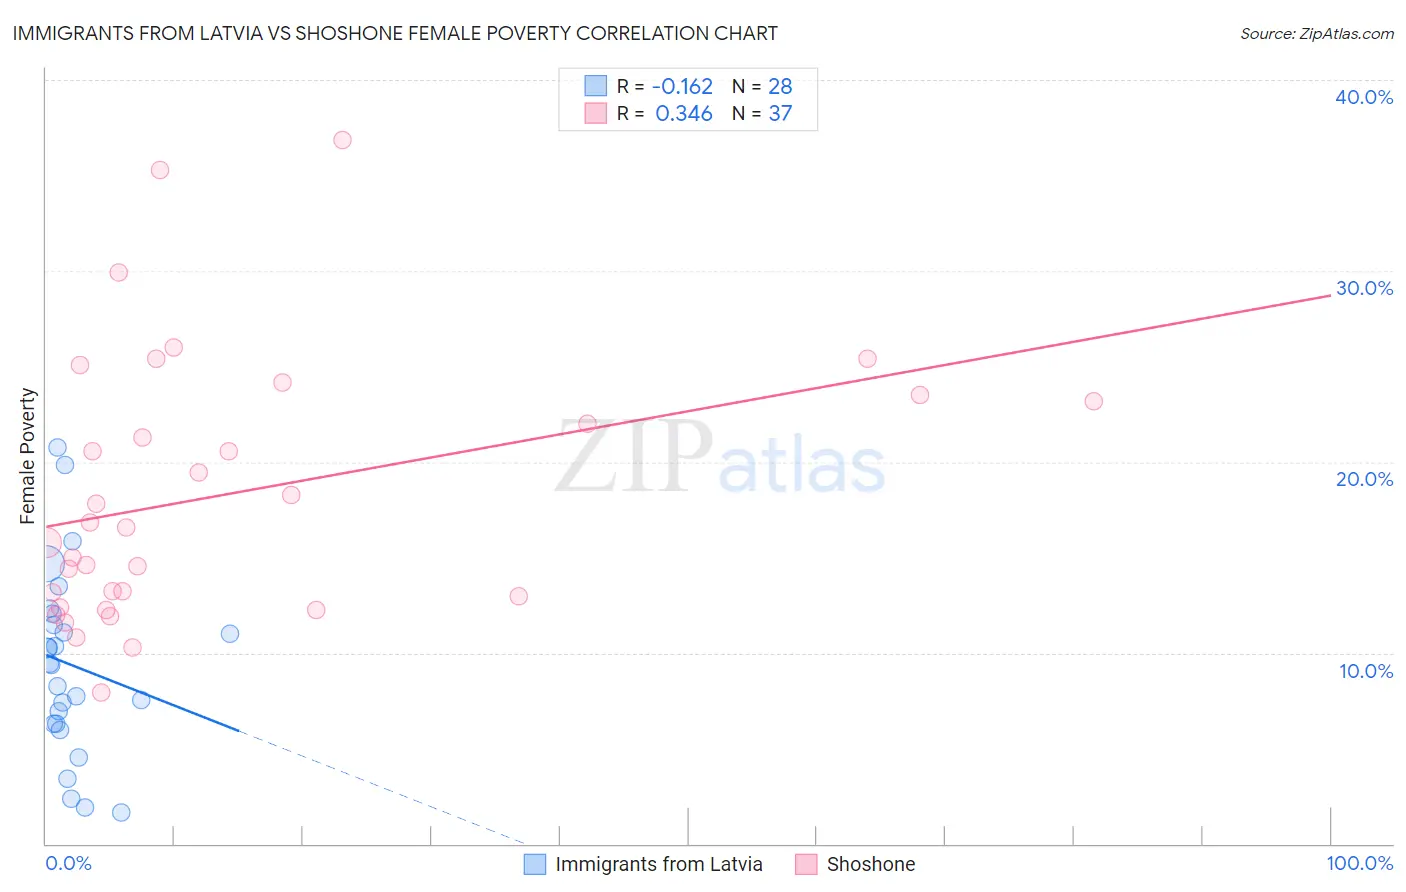
Immigrants from Latvia vs Shoshone Female Poverty Correlation Chart
The statistical analysis conducted on geographies consisting of 113,716,282 people shows a poor negative correlation between the proportion of Immigrants from Latvia and poverty level among females in the United States with a correlation coefficient (R) of -0.162 and weighted average of 12.5%. Similarly, the statistical analysis conducted on geographies consisting of 66,611,766 people shows a mild positive correlation between the proportion of Shoshone and poverty level among females in the United States with a correlation coefficient (R) of 0.346 and weighted average of 15.6%, a difference of 24.5%.
Female Poverty Correlation Summary
| Measurement | Immigrants from Latvia | Shoshone |
| Minimum | 1.6% | 8.0% |
| Maximum | 20.7% | 36.8% |
| Range | 19.1% | 28.9% |
| Mean | 9.4% | 18.3% |
| Median | 9.4% | 16.6% |
| Interquartile 25% (IQ1) | 6.3% | 12.7% |
| Interquartile 75% (IQ3) | 11.8% | 23.3% |
| Interquartile Range (IQR) | 5.5% | 10.7% |
| Standard Deviation (Sample) | 4.8% | 6.9% |
| Standard Deviation (Population) | 4.7% | 6.8% |
Similar Demographics by Female Poverty
Demographics Similar to Immigrants from Latvia by Female Poverty
In terms of female poverty, the demographic groups most similar to Immigrants from Latvia are Tlingit-Haida (12.5%, a difference of 0.0%), Romanian (12.5%, a difference of 0.15%), Immigrants from China (12.5%, a difference of 0.15%), Native Hawaiian (12.5%, a difference of 0.17%), and Slavic (12.5%, a difference of 0.17%).
| Demographics | Rating | Rank | Female Poverty |
| Immigrants | Egypt | 95.5 /100 | #93 | Exceptional 12.5% |
| Immigrants | Indonesia | 95.4 /100 | #94 | Exceptional 12.5% |
| Immigrants | South Africa | 95.4 /100 | #95 | Exceptional 12.5% |
| British | 95.2 /100 | #96 | Exceptional 12.5% |
| Australians | 95.2 /100 | #97 | Exceptional 12.5% |
| Native Hawaiians | 95.1 /100 | #98 | Exceptional 12.5% |
| Romanians | 95.1 /100 | #99 | Exceptional 12.5% |
| Immigrants | Latvia | 94.8 /100 | #100 | Exceptional 12.5% |
| Tlingit-Haida | 94.8 /100 | #101 | Exceptional 12.5% |
| Immigrants | China | 94.5 /100 | #102 | Exceptional 12.5% |
| Slavs | 94.5 /100 | #103 | Exceptional 12.5% |
| Palestinians | 94.3 /100 | #104 | Exceptional 12.5% |
| Scottish | 94.1 /100 | #105 | Exceptional 12.5% |
| Immigrants | Turkey | 93.8 /100 | #106 | Exceptional 12.6% |
| Laotians | 93.4 /100 | #107 | Exceptional 12.6% |
Demographics Similar to Shoshone by Female Poverty
In terms of female poverty, the demographic groups most similar to Shoshone are Immigrants from Jamaica (15.6%, a difference of 0.060%), Cape Verdean (15.6%, a difference of 0.12%), Jamaican (15.5%, a difference of 0.19%), Immigrants from Guyana (15.6%, a difference of 0.19%), and Guyanese (15.6%, a difference of 0.29%).
| Demographics | Rating | Rank | Female Poverty |
| Immigrants | Trinidad and Tobago | 0.3 /100 | #251 | Tragic 15.4% |
| Immigrants | Burma/Myanmar | 0.3 /100 | #252 | Tragic 15.4% |
| Liberians | 0.2 /100 | #253 | Tragic 15.4% |
| Trinidadians and Tobagonians | 0.2 /100 | #254 | Tragic 15.4% |
| Ottawa | 0.2 /100 | #255 | Tragic 15.5% |
| Jamaicans | 0.2 /100 | #256 | Tragic 15.5% |
| Immigrants | Jamaica | 0.1 /100 | #257 | Tragic 15.6% |
| Shoshone | 0.1 /100 | #258 | Tragic 15.6% |
| Cape Verdeans | 0.1 /100 | #259 | Tragic 15.6% |
| Immigrants | Guyana | 0.1 /100 | #260 | Tragic 15.6% |
| Guyanese | 0.1 /100 | #261 | Tragic 15.6% |
| Mexican American Indians | 0.1 /100 | #262 | Tragic 15.6% |
| Cherokee | 0.1 /100 | #263 | Tragic 15.6% |
| Immigrants | Ecuador | 0.1 /100 | #264 | Tragic 15.6% |
| Immigrants | Liberia | 0.1 /100 | #265 | Tragic 15.7% |