Immigrants from Latvia vs South American Indian Female Poverty
COMPARE
Immigrants from Latvia
South American Indian
Female Poverty
Female Poverty Comparison
Immigrants from Latvia
South American Indians
12.5%
FEMALE POVERTY
94.8/ 100
METRIC RATING
100th/ 347
METRIC RANK
13.7%
FEMALE POVERTY
28.9/ 100
METRIC RATING
196th/ 347
METRIC RANK
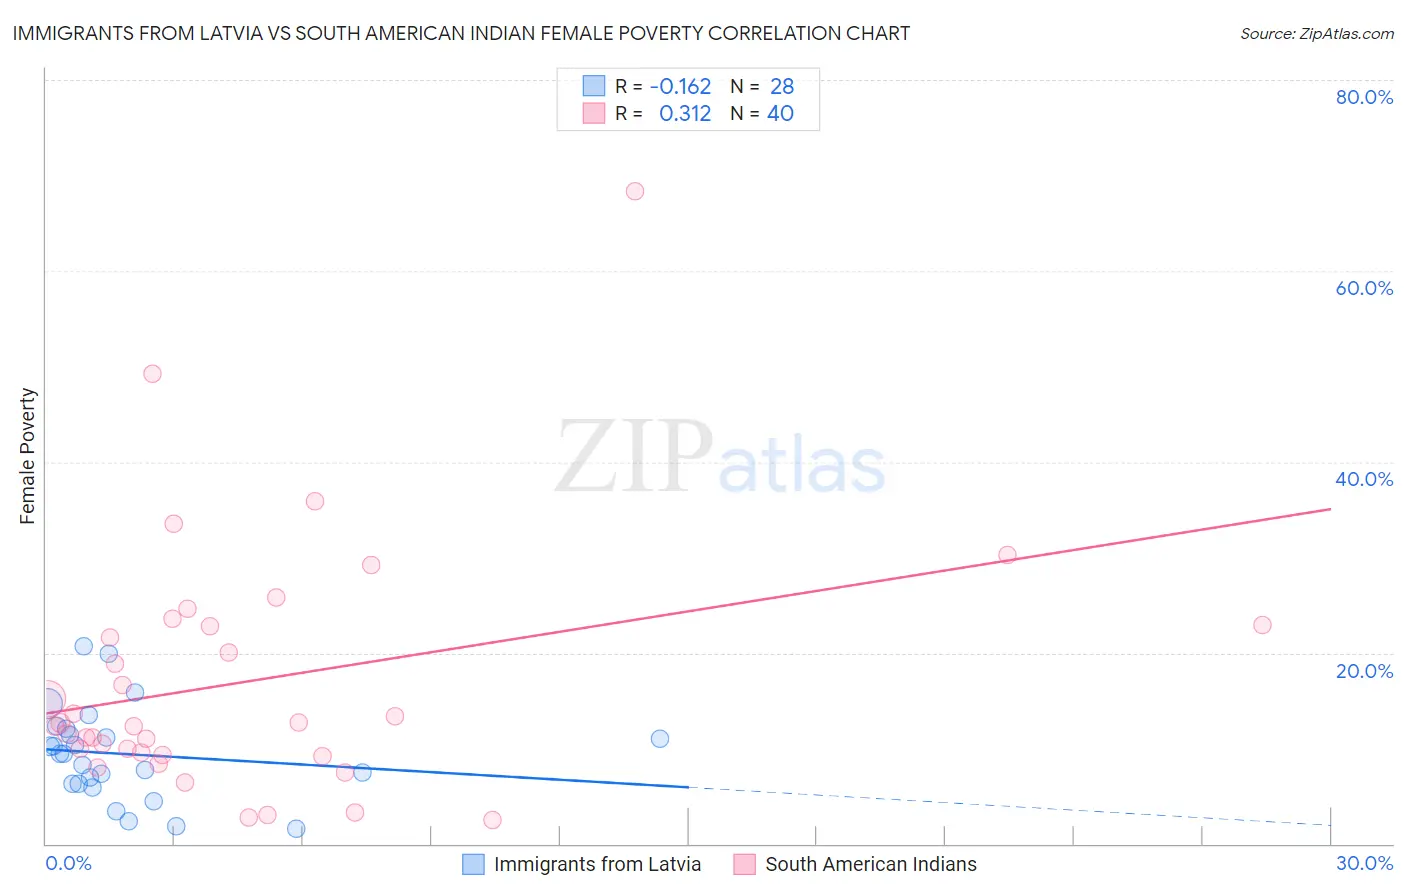
Immigrants from Latvia vs South American Indian Female Poverty Correlation Chart
The statistical analysis conducted on geographies consisting of 113,716,282 people shows a poor negative correlation between the proportion of Immigrants from Latvia and poverty level among females in the United States with a correlation coefficient (R) of -0.162 and weighted average of 12.5%. Similarly, the statistical analysis conducted on geographies consisting of 164,514,214 people shows a mild positive correlation between the proportion of South American Indians and poverty level among females in the United States with a correlation coefficient (R) of 0.312 and weighted average of 13.7%, a difference of 9.9%.
Female Poverty Correlation Summary
| Measurement | Immigrants from Latvia | South American Indian |
| Minimum | 1.6% | 2.4% |
| Maximum | 20.7% | 68.3% |
| Range | 19.1% | 65.9% |
| Mean | 9.4% | 17.0% |
| Median | 9.4% | 12.5% |
| Interquartile 25% (IQ1) | 6.3% | 9.4% |
| Interquartile 75% (IQ3) | 11.8% | 22.8% |
| Interquartile Range (IQR) | 5.5% | 13.4% |
| Standard Deviation (Sample) | 4.8% | 13.0% |
| Standard Deviation (Population) | 4.7% | 12.9% |
Similar Demographics by Female Poverty
Demographics Similar to Immigrants from Latvia by Female Poverty
In terms of female poverty, the demographic groups most similar to Immigrants from Latvia are Tlingit-Haida (12.5%, a difference of 0.0%), Romanian (12.5%, a difference of 0.15%), Immigrants from China (12.5%, a difference of 0.15%), Native Hawaiian (12.5%, a difference of 0.17%), and Slavic (12.5%, a difference of 0.17%).
| Demographics | Rating | Rank | Female Poverty |
| Immigrants | Egypt | 95.5 /100 | #93 | Exceptional 12.5% |
| Immigrants | Indonesia | 95.4 /100 | #94 | Exceptional 12.5% |
| Immigrants | South Africa | 95.4 /100 | #95 | Exceptional 12.5% |
| British | 95.2 /100 | #96 | Exceptional 12.5% |
| Australians | 95.2 /100 | #97 | Exceptional 12.5% |
| Native Hawaiians | 95.1 /100 | #98 | Exceptional 12.5% |
| Romanians | 95.1 /100 | #99 | Exceptional 12.5% |
| Immigrants | Latvia | 94.8 /100 | #100 | Exceptional 12.5% |
| Tlingit-Haida | 94.8 /100 | #101 | Exceptional 12.5% |
| Immigrants | China | 94.5 /100 | #102 | Exceptional 12.5% |
| Slavs | 94.5 /100 | #103 | Exceptional 12.5% |
| Palestinians | 94.3 /100 | #104 | Exceptional 12.5% |
| Scottish | 94.1 /100 | #105 | Exceptional 12.5% |
| Immigrants | Turkey | 93.8 /100 | #106 | Exceptional 12.6% |
| Laotians | 93.4 /100 | #107 | Exceptional 12.6% |
Demographics Similar to South American Indians by Female Poverty
In terms of female poverty, the demographic groups most similar to South American Indians are Arab (13.7%, a difference of 0.040%), Immigrants from Uganda (13.7%, a difference of 0.060%), Immigrants from South America (13.7%, a difference of 0.19%), Delaware (13.7%, a difference of 0.25%), and Iraqi (13.7%, a difference of 0.31%).
| Demographics | Rating | Rank | Female Poverty |
| Uruguayans | 39.8 /100 | #189 | Fair 13.6% |
| Sierra Leoneans | 33.1 /100 | #190 | Fair 13.7% |
| Immigrants | Kuwait | 32.7 /100 | #191 | Fair 13.7% |
| Immigrants | Costa Rica | 31.9 /100 | #192 | Fair 13.7% |
| Iraqis | 31.8 /100 | #193 | Fair 13.7% |
| Delaware | 31.1 /100 | #194 | Fair 13.7% |
| Immigrants | South America | 30.6 /100 | #195 | Fair 13.7% |
| South American Indians | 28.9 /100 | #196 | Fair 13.7% |
| Arabs | 28.6 /100 | #197 | Fair 13.7% |
| Immigrants | Uganda | 28.5 /100 | #198 | Fair 13.7% |
| Immigrants | Lebanon | 25.6 /100 | #199 | Fair 13.8% |
| Spanish | 21.4 /100 | #200 | Fair 13.9% |
| Immigrants | Kenya | 21.1 /100 | #201 | Fair 13.9% |
| Hmong | 21.1 /100 | #202 | Fair 13.9% |
| Immigrants | Western Asia | 20.7 /100 | #203 | Fair 13.9% |