French Canadian vs Yugoslavian Female Poverty
COMPARE
French Canadian
Yugoslavian
Female Poverty
Female Poverty Comparison
French Canadians
Yugoslavians
12.7%
FEMALE POVERTY
90.2/ 100
METRIC RATING
122nd/ 347
METRIC RANK
13.1%
FEMALE POVERTY
76.9/ 100
METRIC RATING
148th/ 347
METRIC RANK
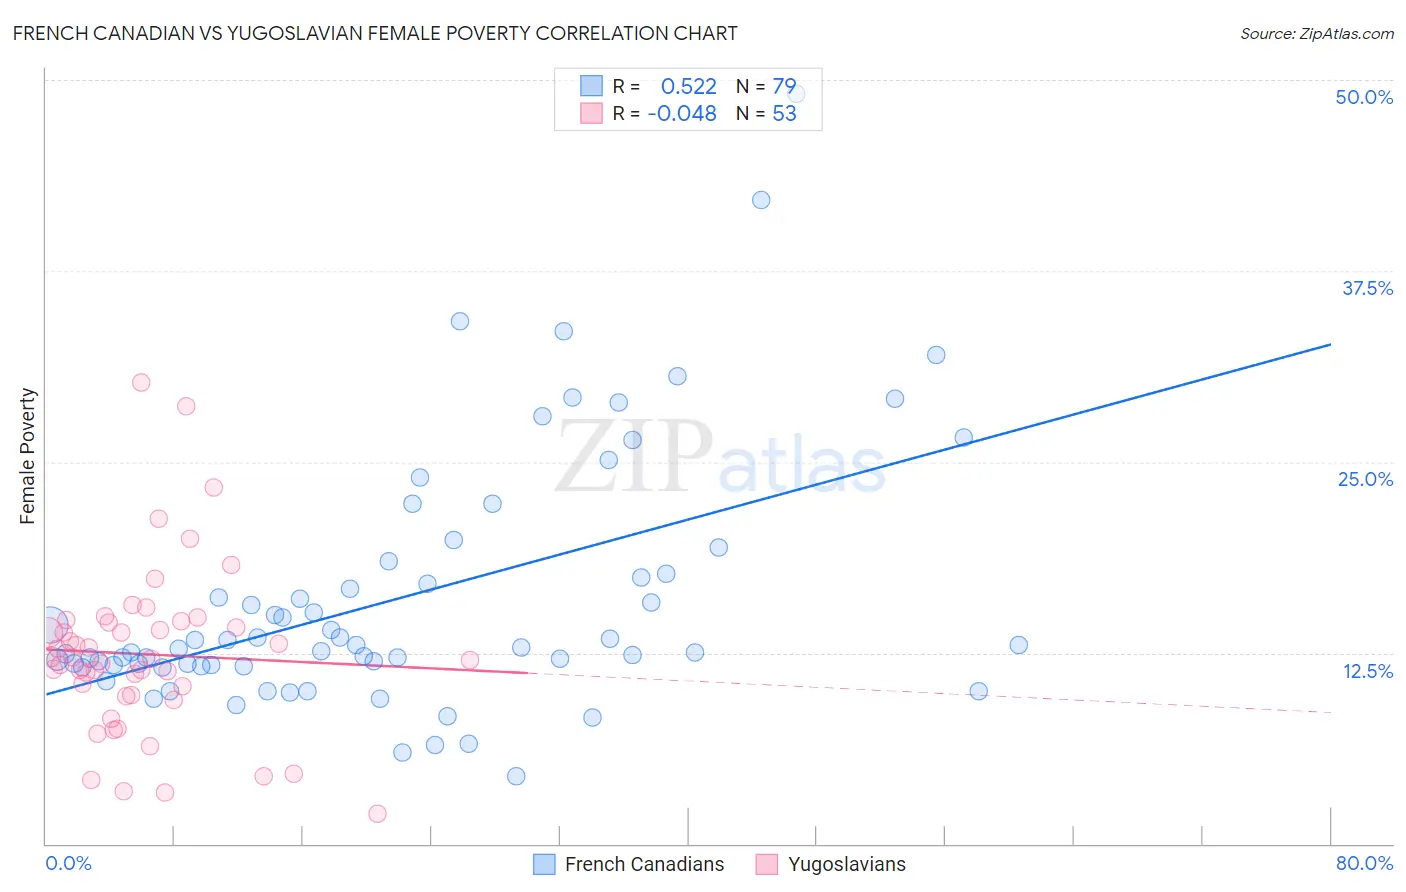
French Canadian vs Yugoslavian Female Poverty Correlation Chart
The statistical analysis conducted on geographies consisting of 502,012,927 people shows a substantial positive correlation between the proportion of French Canadians and poverty level among females in the United States with a correlation coefficient (R) of 0.522 and weighted average of 12.7%. Similarly, the statistical analysis conducted on geographies consisting of 285,591,967 people shows no correlation between the proportion of Yugoslavians and poverty level among females in the United States with a correlation coefficient (R) of -0.048 and weighted average of 13.1%, a difference of 2.6%.
Female Poverty Correlation Summary
| Measurement | French Canadian | Yugoslavian |
| Minimum | 4.4% | 2.0% |
| Maximum | 49.1% | 30.2% |
| Range | 44.7% | 28.2% |
| Mean | 16.1% | 12.4% |
| Median | 12.8% | 12.1% |
| Interquartile 25% (IQ1) | 11.7% | 9.7% |
| Interquartile 75% (IQ3) | 17.6% | 14.5% |
| Interquartile Range (IQR) | 6.0% | 4.8% |
| Standard Deviation (Sample) | 8.3% | 5.5% |
| Standard Deviation (Population) | 8.2% | 5.5% |
Similar Demographics by Female Poverty
Demographics Similar to French Canadians by Female Poverty
In terms of female poverty, the demographic groups most similar to French Canadians are Immigrants from Hungary (12.7%, a difference of 0.040%), Immigrants from South Eastern Asia (12.7%, a difference of 0.070%), New Zealander (12.7%, a difference of 0.14%), Albanian (12.7%, a difference of 0.20%), and Sri Lankan (12.7%, a difference of 0.21%).
| Demographics | Rating | Rank | Female Poverty |
| Puget Sound Salish | 91.5 /100 | #115 | Exceptional 12.7% |
| Immigrants | Russia | 91.2 /100 | #116 | Exceptional 12.7% |
| Immigrants | Southern Europe | 90.9 /100 | #117 | Exceptional 12.7% |
| Sri Lankans | 90.9 /100 | #118 | Exceptional 12.7% |
| Albanians | 90.8 /100 | #119 | Exceptional 12.7% |
| New Zealanders | 90.6 /100 | #120 | Exceptional 12.7% |
| Immigrants | Hungary | 90.3 /100 | #121 | Exceptional 12.7% |
| French Canadians | 90.2 /100 | #122 | Exceptional 12.7% |
| Immigrants | South Eastern Asia | 89.9 /100 | #123 | Excellent 12.7% |
| Immigrants | Norway | 89.3 /100 | #124 | Excellent 12.8% |
| Argentineans | 89.1 /100 | #125 | Excellent 12.8% |
| Immigrants | Ukraine | 88.8 /100 | #126 | Excellent 12.8% |
| South Africans | 88.4 /100 | #127 | Excellent 12.8% |
| Immigrants | Belarus | 88.2 /100 | #128 | Excellent 12.8% |
| Immigrants | Brazil | 87.9 /100 | #129 | Excellent 12.8% |
Demographics Similar to Yugoslavians by Female Poverty
In terms of female poverty, the demographic groups most similar to Yugoslavians are Taiwanese (13.1%, a difference of 0.16%), Tsimshian (13.1%, a difference of 0.19%), Immigrants from Kazakhstan (13.0%, a difference of 0.25%), Immigrants from Germany (13.1%, a difference of 0.26%), and Immigrants from Peru (13.0%, a difference of 0.33%).
| Demographics | Rating | Rank | Female Poverty |
| Icelanders | 81.1 /100 | #141 | Excellent 13.0% |
| Brazilians | 80.5 /100 | #142 | Excellent 13.0% |
| Immigrants | Malaysia | 80.4 /100 | #143 | Excellent 13.0% |
| Afghans | 79.8 /100 | #144 | Good 13.0% |
| Syrians | 79.6 /100 | #145 | Good 13.0% |
| Immigrants | Peru | 79.1 /100 | #146 | Good 13.0% |
| Immigrants | Kazakhstan | 78.6 /100 | #147 | Good 13.0% |
| Yugoslavians | 76.9 /100 | #148 | Good 13.1% |
| Taiwanese | 75.7 /100 | #149 | Good 13.1% |
| Tsimshian | 75.5 /100 | #150 | Good 13.1% |
| Immigrants | Germany | 74.9 /100 | #151 | Good 13.1% |
| Samoans | 73.6 /100 | #152 | Good 13.1% |
| Immigrants | Fiji | 71.0 /100 | #153 | Good 13.2% |
| Armenians | 70.4 /100 | #154 | Good 13.2% |
| Hungarians | 70.1 /100 | #155 | Good 13.2% |