Immigrants from Latvia vs Nonimmigrants Married-Couple Family Poverty
COMPARE
Immigrants from Latvia
Nonimmigrants
Married-Couple Family Poverty
Married-Couple Family Poverty Comparison
Immigrants from Latvia
Nonimmigrants
4.5%
MARRIED-COUPLE FAMILY POVERTY
99.1/ 100
METRIC RATING
77th/ 347
METRIC RANK
5.3%
MARRIED-COUPLE FAMILY POVERTY
35.8/ 100
METRIC RATING
184th/ 347
METRIC RANK
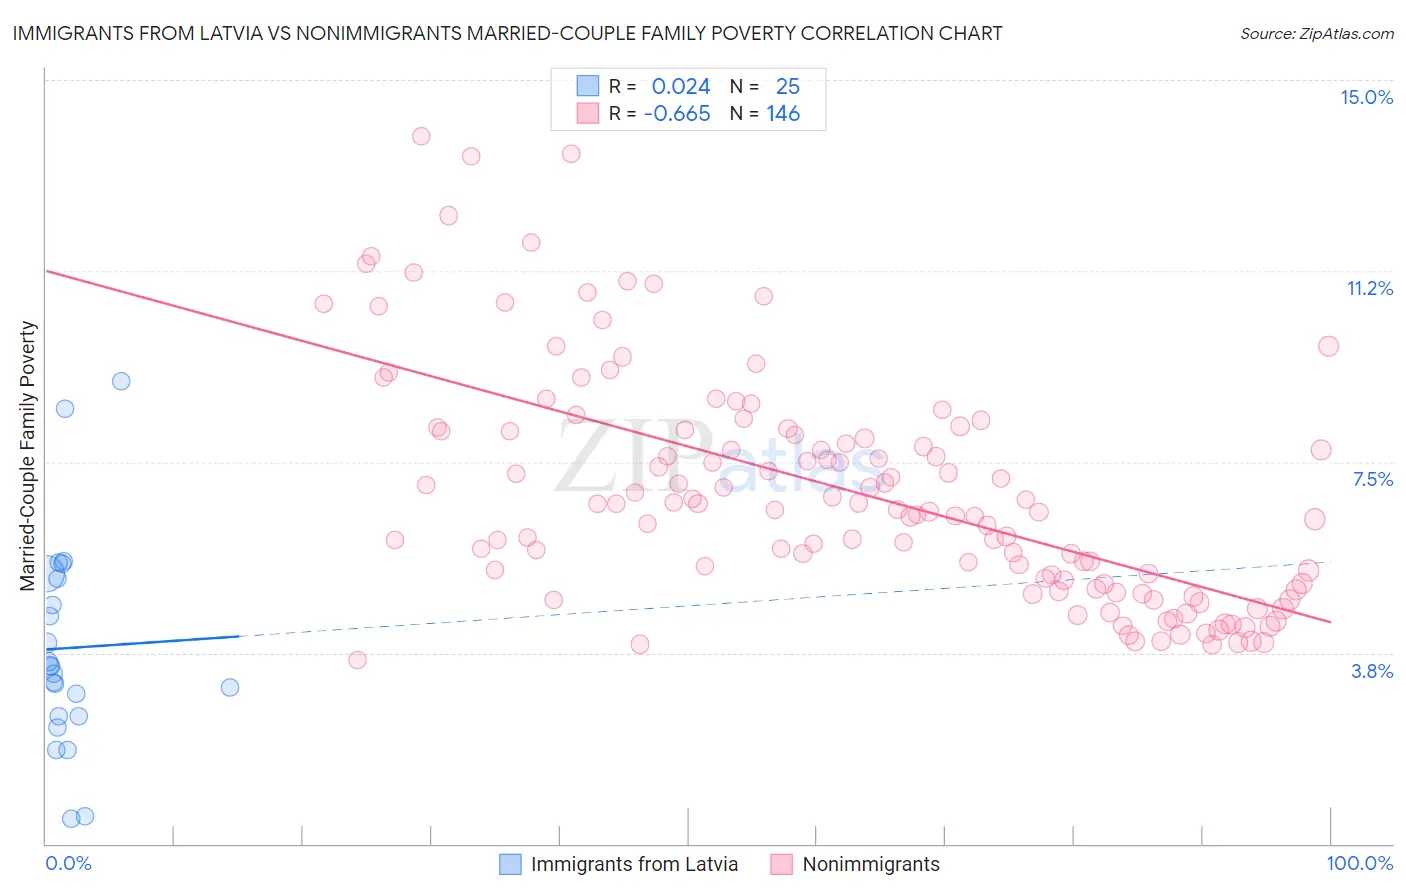
Immigrants from Latvia vs Nonimmigrants Married-Couple Family Poverty Correlation Chart
The statistical analysis conducted on geographies consisting of 113,402,178 people shows no correlation between the proportion of Immigrants from Latvia and poverty level among married-couple families in the United States with a correlation coefficient (R) of 0.024 and weighted average of 4.5%. Similarly, the statistical analysis conducted on geographies consisting of 567,493,090 people shows a significant negative correlation between the proportion of Nonimmigrants and poverty level among married-couple families in the United States with a correlation coefficient (R) of -0.665 and weighted average of 5.3%, a difference of 17.7%.
Married-Couple Family Poverty Correlation Summary
| Measurement | Immigrants from Latvia | Nonimmigrants |
| Minimum | 0.50% | 3.6% |
| Maximum | 9.1% | 13.9% |
| Range | 8.6% | 10.3% |
| Mean | 3.8% | 6.9% |
| Median | 3.5% | 6.6% |
| Interquartile 25% (IQ1) | 2.5% | 5.1% |
| Interquartile 75% (IQ3) | 5.3% | 8.1% |
| Interquartile Range (IQR) | 2.8% | 3.0% |
| Standard Deviation (Sample) | 2.1% | 2.3% |
| Standard Deviation (Population) | 2.0% | 2.2% |
Similar Demographics by Married-Couple Family Poverty
Demographics Similar to Immigrants from Latvia by Married-Couple Family Poverty
In terms of married-couple family poverty, the demographic groups most similar to Immigrants from Latvia are Scotch-Irish (4.5%, a difference of 0.080%), Immigrants from South Africa (4.5%, a difference of 0.17%), Cambodian (4.5%, a difference of 0.28%), Immigrants from Iran (4.5%, a difference of 0.31%), and Icelander (4.5%, a difference of 0.38%).
| Demographics | Rating | Rank | Married-Couple Family Poverty |
| Immigrants | Korea | 99.4 /100 | #70 | Exceptional 4.5% |
| Immigrants | North America | 99.3 /100 | #71 | Exceptional 4.5% |
| Immigrants | England | 99.3 /100 | #72 | Exceptional 4.5% |
| Ukrainians | 99.2 /100 | #73 | Exceptional 4.5% |
| Immigrants | Austria | 99.2 /100 | #74 | Exceptional 4.5% |
| Cambodians | 99.2 /100 | #75 | Exceptional 4.5% |
| Immigrants | South Africa | 99.1 /100 | #76 | Exceptional 4.5% |
| Immigrants | Latvia | 99.1 /100 | #77 | Exceptional 4.5% |
| Scotch-Irish | 99.1 /100 | #78 | Exceptional 4.5% |
| Immigrants | Iran | 99.0 /100 | #79 | Exceptional 4.5% |
| Icelanders | 99.0 /100 | #80 | Exceptional 4.5% |
| Immigrants | Greece | 98.9 /100 | #81 | Exceptional 4.5% |
| Canadians | 98.8 /100 | #82 | Exceptional 4.5% |
| Immigrants | Denmark | 98.8 /100 | #83 | Exceptional 4.6% |
| Immigrants | Croatia | 98.7 /100 | #84 | Exceptional 4.6% |
Demographics Similar to Nonimmigrants by Married-Couple Family Poverty
In terms of married-couple family poverty, the demographic groups most similar to Nonimmigrants are American (5.3%, a difference of 0.060%), Hungarian (5.3%, a difference of 0.13%), Peruvian (5.3%, a difference of 0.22%), Immigrants from Vietnam (5.3%, a difference of 0.24%), and Immigrants from Albania (5.3%, a difference of 0.25%).
| Demographics | Rating | Rank | Married-Couple Family Poverty |
| Immigrants | Kazakhstan | 45.1 /100 | #177 | Average 5.2% |
| Immigrants | Ukraine | 44.9 /100 | #178 | Average 5.2% |
| Spanish | 41.4 /100 | #179 | Average 5.3% |
| Immigrants | Sierra Leone | 39.3 /100 | #180 | Fair 5.3% |
| Immigrants | Chile | 38.8 /100 | #181 | Fair 5.3% |
| Immigrants | Vietnam | 37.7 /100 | #182 | Fair 5.3% |
| Peruvians | 37.6 /100 | #183 | Fair 5.3% |
| Immigrants | Nonimmigrants | 35.8 /100 | #184 | Fair 5.3% |
| Americans | 35.4 /100 | #185 | Fair 5.3% |
| Hungarians | 34.7 /100 | #186 | Fair 5.3% |
| Immigrants | Albania | 33.8 /100 | #187 | Fair 5.3% |
| Israelis | 33.1 /100 | #188 | Fair 5.3% |
| South American Indians | 32.5 /100 | #189 | Fair 5.3% |
| Ugandans | 31.6 /100 | #190 | Fair 5.3% |
| Immigrants | Cabo Verde | 30.9 /100 | #191 | Fair 5.3% |