Immigrants from Latvia vs Irish Married-Couple Family Poverty
COMPARE
Immigrants from Latvia
Irish
Married-Couple Family Poverty
Married-Couple Family Poverty Comparison
Immigrants from Latvia
Irish
4.5%
MARRIED-COUPLE FAMILY POVERTY
99.1/ 100
METRIC RATING
77th/ 347
METRIC RANK
4.2%
MARRIED-COUPLE FAMILY POVERTY
99.9/ 100
METRIC RATING
33rd/ 347
METRIC RANK
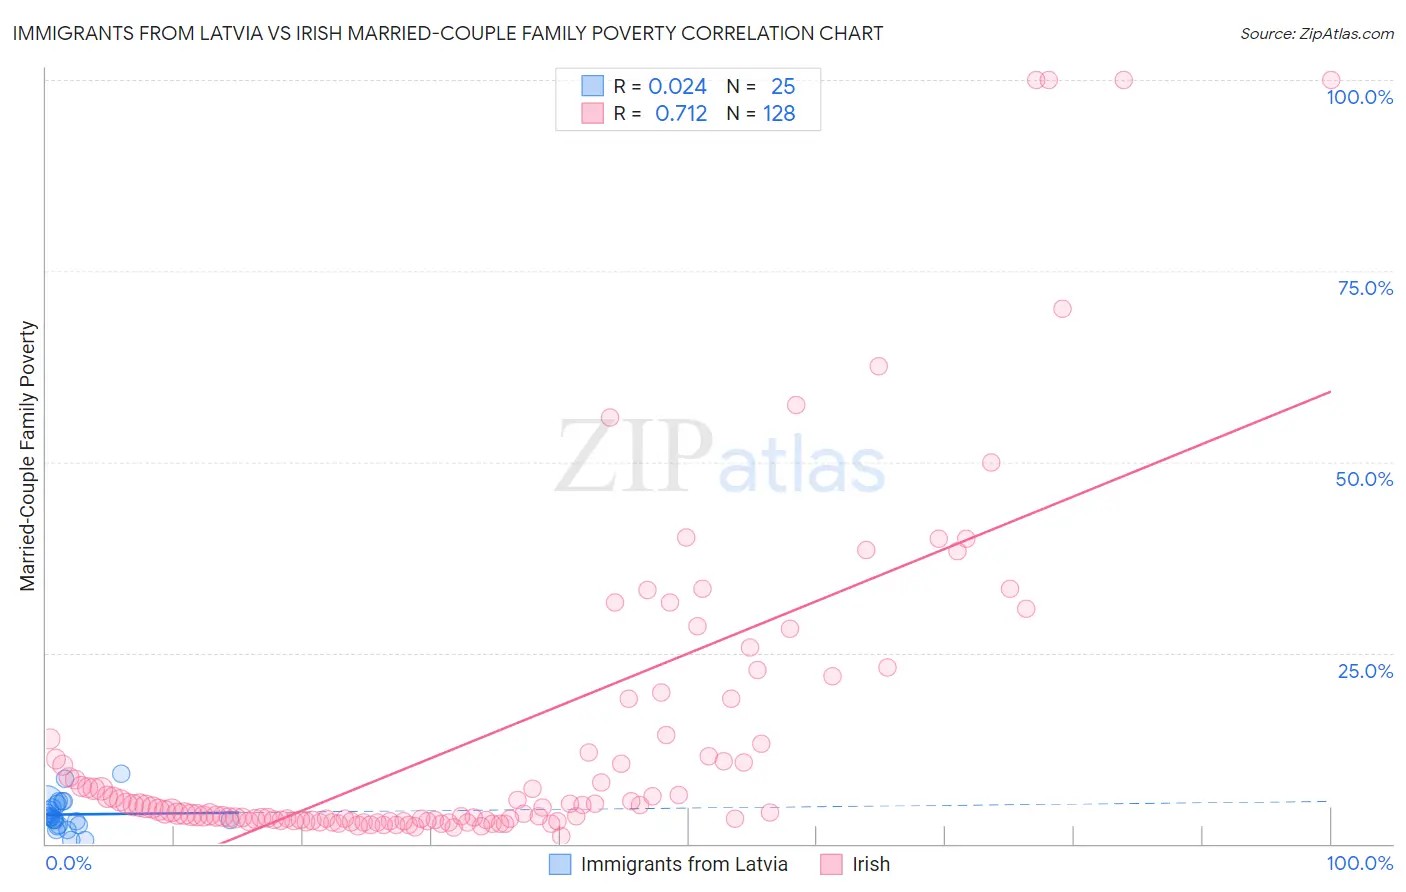
Immigrants from Latvia vs Irish Married-Couple Family Poverty Correlation Chart
The statistical analysis conducted on geographies consisting of 113,402,178 people shows no correlation between the proportion of Immigrants from Latvia and poverty level among married-couple families in the United States with a correlation coefficient (R) of 0.024 and weighted average of 4.5%. Similarly, the statistical analysis conducted on geographies consisting of 563,529,593 people shows a strong positive correlation between the proportion of Irish and poverty level among married-couple families in the United States with a correlation coefficient (R) of 0.712 and weighted average of 4.2%, a difference of 7.7%.
Married-Couple Family Poverty Correlation Summary
| Measurement | Immigrants from Latvia | Irish |
| Minimum | 0.50% | 0.92% |
| Maximum | 9.1% | 100.0% |
| Range | 8.6% | 99.1% |
| Mean | 3.8% | 13.8% |
| Median | 3.5% | 4.6% |
| Interquartile 25% (IQ1) | 2.5% | 3.1% |
| Interquartile 75% (IQ3) | 5.3% | 12.5% |
| Interquartile Range (IQR) | 2.8% | 9.4% |
| Standard Deviation (Sample) | 2.1% | 20.9% |
| Standard Deviation (Population) | 2.0% | 20.8% |
Similar Demographics by Married-Couple Family Poverty
Demographics Similar to Immigrants from Latvia by Married-Couple Family Poverty
In terms of married-couple family poverty, the demographic groups most similar to Immigrants from Latvia are Scotch-Irish (4.5%, a difference of 0.080%), Immigrants from South Africa (4.5%, a difference of 0.17%), Cambodian (4.5%, a difference of 0.28%), Immigrants from Iran (4.5%, a difference of 0.31%), and Icelander (4.5%, a difference of 0.38%).
| Demographics | Rating | Rank | Married-Couple Family Poverty |
| Immigrants | Korea | 99.4 /100 | #70 | Exceptional 4.5% |
| Immigrants | North America | 99.3 /100 | #71 | Exceptional 4.5% |
| Immigrants | England | 99.3 /100 | #72 | Exceptional 4.5% |
| Ukrainians | 99.2 /100 | #73 | Exceptional 4.5% |
| Immigrants | Austria | 99.2 /100 | #74 | Exceptional 4.5% |
| Cambodians | 99.2 /100 | #75 | Exceptional 4.5% |
| Immigrants | South Africa | 99.1 /100 | #76 | Exceptional 4.5% |
| Immigrants | Latvia | 99.1 /100 | #77 | Exceptional 4.5% |
| Scotch-Irish | 99.1 /100 | #78 | Exceptional 4.5% |
| Immigrants | Iran | 99.0 /100 | #79 | Exceptional 4.5% |
| Icelanders | 99.0 /100 | #80 | Exceptional 4.5% |
| Immigrants | Greece | 98.9 /100 | #81 | Exceptional 4.5% |
| Canadians | 98.8 /100 | #82 | Exceptional 4.5% |
| Immigrants | Denmark | 98.8 /100 | #83 | Exceptional 4.6% |
| Immigrants | Croatia | 98.7 /100 | #84 | Exceptional 4.6% |
Demographics Similar to Irish by Married-Couple Family Poverty
In terms of married-couple family poverty, the demographic groups most similar to Irish are Dutch (4.2%, a difference of 0.23%), Greek (4.2%, a difference of 0.48%), Estonian (4.2%, a difference of 0.59%), Finnish (4.2%, a difference of 0.67%), and European (4.2%, a difference of 0.80%).
| Demographics | Rating | Rank | Married-Couple Family Poverty |
| Cypriots | 99.9 /100 | #26 | Exceptional 4.1% |
| Danes | 99.9 /100 | #27 | Exceptional 4.1% |
| Scandinavians | 99.9 /100 | #28 | Exceptional 4.1% |
| Immigrants | Scotland | 99.9 /100 | #29 | Exceptional 4.2% |
| Finns | 99.9 /100 | #30 | Exceptional 4.2% |
| Estonians | 99.9 /100 | #31 | Exceptional 4.2% |
| Greeks | 99.9 /100 | #32 | Exceptional 4.2% |
| Irish | 99.9 /100 | #33 | Exceptional 4.2% |
| Dutch | 99.9 /100 | #34 | Exceptional 4.2% |
| Europeans | 99.9 /100 | #35 | Exceptional 4.2% |
| English | 99.9 /100 | #36 | Exceptional 4.2% |
| Iranians | 99.9 /100 | #37 | Exceptional 4.2% |
| Belgians | 99.9 /100 | #38 | Exceptional 4.2% |
| Immigrants | Northern Europe | 99.8 /100 | #39 | Exceptional 4.2% |
| French Canadians | 99.8 /100 | #40 | Exceptional 4.2% |