Immigrants from Latvia vs Uruguayan Married-Couple Family Poverty
COMPARE
Immigrants from Latvia
Uruguayan
Married-Couple Family Poverty
Married-Couple Family Poverty Comparison
Immigrants from Latvia
Uruguayans
4.5%
MARRIED-COUPLE FAMILY POVERTY
99.1/ 100
METRIC RATING
77th/ 347
METRIC RANK
5.4%
MARRIED-COUPLE FAMILY POVERTY
25.0/ 100
METRIC RATING
199th/ 347
METRIC RANK
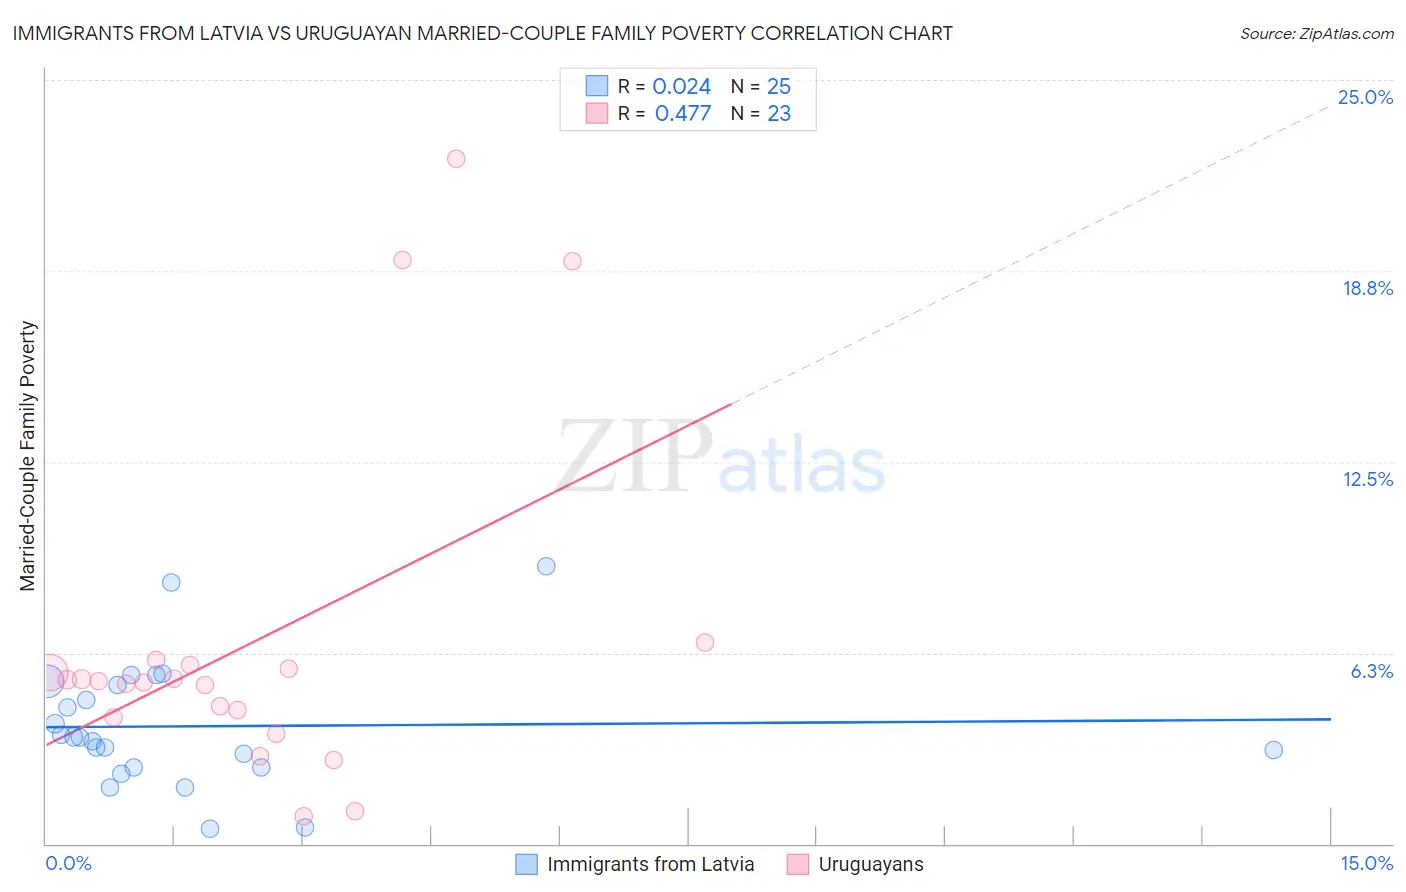
Immigrants from Latvia vs Uruguayan Married-Couple Family Poverty Correlation Chart
The statistical analysis conducted on geographies consisting of 113,402,178 people shows no correlation between the proportion of Immigrants from Latvia and poverty level among married-couple families in the United States with a correlation coefficient (R) of 0.024 and weighted average of 4.5%. Similarly, the statistical analysis conducted on geographies consisting of 144,309,932 people shows a moderate positive correlation between the proportion of Uruguayans and poverty level among married-couple families in the United States with a correlation coefficient (R) of 0.477 and weighted average of 5.4%, a difference of 19.4%.
Married-Couple Family Poverty Correlation Summary
| Measurement | Immigrants from Latvia | Uruguayan |
| Minimum | 0.50% | 0.92% |
| Maximum | 9.1% | 22.4% |
| Range | 8.6% | 21.5% |
| Mean | 3.8% | 6.6% |
| Median | 3.5% | 5.3% |
| Interquartile 25% (IQ1) | 2.5% | 4.1% |
| Interquartile 75% (IQ3) | 5.3% | 5.8% |
| Interquartile Range (IQR) | 2.8% | 1.7% |
| Standard Deviation (Sample) | 2.1% | 5.6% |
| Standard Deviation (Population) | 2.0% | 5.5% |
Similar Demographics by Married-Couple Family Poverty
Demographics Similar to Immigrants from Latvia by Married-Couple Family Poverty
In terms of married-couple family poverty, the demographic groups most similar to Immigrants from Latvia are Scotch-Irish (4.5%, a difference of 0.080%), Immigrants from South Africa (4.5%, a difference of 0.17%), Cambodian (4.5%, a difference of 0.28%), Immigrants from Iran (4.5%, a difference of 0.31%), and Icelander (4.5%, a difference of 0.38%).
| Demographics | Rating | Rank | Married-Couple Family Poverty |
| Immigrants | Korea | 99.4 /100 | #70 | Exceptional 4.5% |
| Immigrants | North America | 99.3 /100 | #71 | Exceptional 4.5% |
| Immigrants | England | 99.3 /100 | #72 | Exceptional 4.5% |
| Ukrainians | 99.2 /100 | #73 | Exceptional 4.5% |
| Immigrants | Austria | 99.2 /100 | #74 | Exceptional 4.5% |
| Cambodians | 99.2 /100 | #75 | Exceptional 4.5% |
| Immigrants | South Africa | 99.1 /100 | #76 | Exceptional 4.5% |
| Immigrants | Latvia | 99.1 /100 | #77 | Exceptional 4.5% |
| Scotch-Irish | 99.1 /100 | #78 | Exceptional 4.5% |
| Immigrants | Iran | 99.0 /100 | #79 | Exceptional 4.5% |
| Icelanders | 99.0 /100 | #80 | Exceptional 4.5% |
| Immigrants | Greece | 98.9 /100 | #81 | Exceptional 4.5% |
| Canadians | 98.8 /100 | #82 | Exceptional 4.5% |
| Immigrants | Denmark | 98.8 /100 | #83 | Exceptional 4.6% |
| Immigrants | Croatia | 98.7 /100 | #84 | Exceptional 4.6% |
Demographics Similar to Uruguayans by Married-Couple Family Poverty
In terms of married-couple family poverty, the demographic groups most similar to Uruguayans are Immigrants from Morocco (5.4%, a difference of 0.11%), Lebanese (5.4%, a difference of 0.13%), Immigrants from Belarus (5.4%, a difference of 0.18%), Immigrants from Middle Africa (5.4%, a difference of 0.19%), and Liberian (5.4%, a difference of 0.20%).
| Demographics | Rating | Rank | Married-Couple Family Poverty |
| Cape Verdeans | 30.7 /100 | #192 | Fair 5.3% |
| Malaysians | 29.5 /100 | #193 | Fair 5.4% |
| Immigrants | Israel | 27.8 /100 | #194 | Fair 5.4% |
| Immigrants | Azores | 27.5 /100 | #195 | Fair 5.4% |
| Spaniards | 27.4 /100 | #196 | Fair 5.4% |
| Liberians | 26.3 /100 | #197 | Fair 5.4% |
| Immigrants | Belarus | 26.2 /100 | #198 | Fair 5.4% |
| Uruguayans | 25.0 /100 | #199 | Fair 5.4% |
| Immigrants | Morocco | 24.3 /100 | #200 | Fair 5.4% |
| Lebanese | 24.1 /100 | #201 | Fair 5.4% |
| Immigrants | Middle Africa | 23.8 /100 | #202 | Fair 5.4% |
| Immigrants | Peru | 21.8 /100 | #203 | Fair 5.4% |
| Immigrants | Costa Rica | 19.4 /100 | #204 | Poor 5.4% |
| Chippewa | 18.9 /100 | #205 | Poor 5.4% |
| Osage | 18.4 /100 | #206 | Poor 5.4% |