Immigrants from Latvia vs Nonimmigrants In Labor Force | Age 20-24
COMPARE
Immigrants from Latvia
Nonimmigrants
In Labor Force | Age 20-24
In Labor Force | Age 20-24 Comparison
Immigrants from Latvia
Nonimmigrants
75.0%
IN LABOR FORCE | AGE 20-24
44.1/ 100
METRIC RATING
179th/ 347
METRIC RANK
76.2%
IN LABOR FORCE | AGE 20-24
98.5/ 100
METRIC RATING
96th/ 347
METRIC RANK
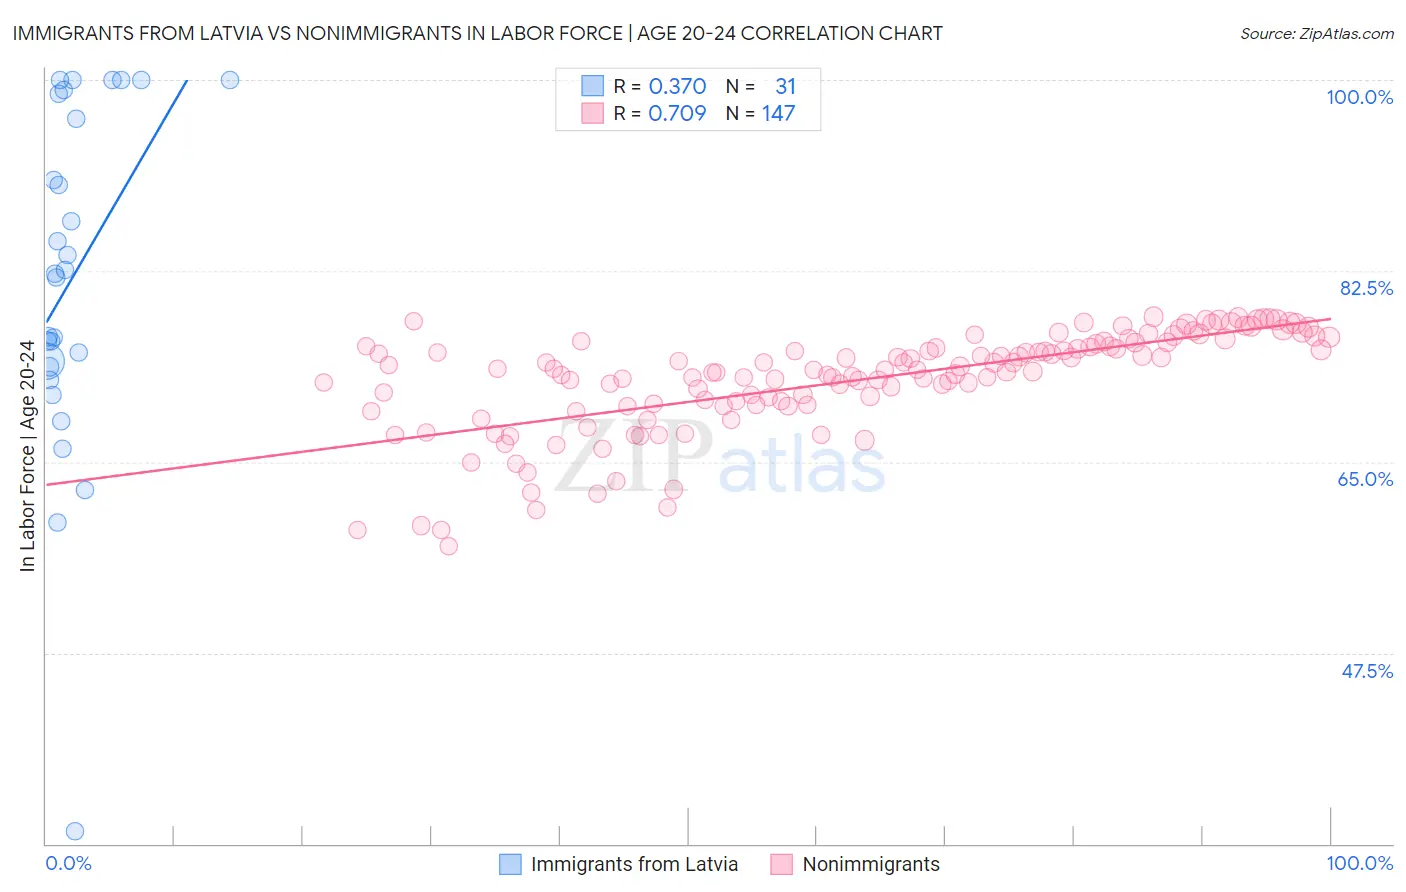
Immigrants from Latvia vs Nonimmigrants In Labor Force | Age 20-24 Correlation Chart
The statistical analysis conducted on geographies consisting of 113,730,913 people shows a mild positive correlation between the proportion of Immigrants from Latvia and labor force participation rate among population between the ages 20 and 24 in the United States with a correlation coefficient (R) of 0.370 and weighted average of 75.0%. Similarly, the statistical analysis conducted on geographies consisting of 582,321,268 people shows a strong positive correlation between the proportion of Nonimmigrants and labor force participation rate among population between the ages 20 and 24 in the United States with a correlation coefficient (R) of 0.709 and weighted average of 76.2%, a difference of 1.6%.
In Labor Force | Age 20-24 Correlation Summary
| Measurement | Immigrants from Latvia | Nonimmigrants |
| Minimum | 31.2% | 57.2% |
| Maximum | 100.0% | 78.3% |
| Range | 68.8% | 21.1% |
| Mean | 81.9% | 72.5% |
| Median | 82.3% | 73.4% |
| Interquartile 25% (IQ1) | 73.7% | 70.2% |
| Interquartile 75% (IQ3) | 98.7% | 75.8% |
| Interquartile Range (IQR) | 25.0% | 5.6% |
| Standard Deviation (Sample) | 15.6% | 4.7% |
| Standard Deviation (Population) | 15.4% | 4.6% |
Similar Demographics by In Labor Force | Age 20-24
Demographics Similar to Immigrants from Latvia by In Labor Force | Age 20-24
In terms of in labor force | age 20-24, the demographic groups most similar to Immigrants from Latvia are Immigrants from Czechoslovakia (75.0%, a difference of 0.0%), Immigrants from Central America (75.0%, a difference of 0.010%), African (75.0%, a difference of 0.020%), Immigrants from Mexico (75.0%, a difference of 0.060%), and Central American (75.0%, a difference of 0.070%).
| Demographics | Rating | Rank | In Labor Force | Age 20-24 |
| Yakama | 50.8 /100 | #172 | Average 75.1% |
| Immigrants | Croatia | 50.2 /100 | #173 | Average 75.1% |
| South Africans | 50.0 /100 | #174 | Average 75.0% |
| Syrians | 49.5 /100 | #175 | Average 75.0% |
| Central Americans | 48.7 /100 | #176 | Average 75.0% |
| Immigrants | Mexico | 47.8 /100 | #177 | Average 75.0% |
| Immigrants | Central America | 45.0 /100 | #178 | Average 75.0% |
| Immigrants | Latvia | 44.1 /100 | #179 | Average 75.0% |
| Immigrants | Czechoslovakia | 44.0 /100 | #180 | Average 75.0% |
| Africans | 42.5 /100 | #181 | Average 75.0% |
| Immigrants | South Africa | 36.9 /100 | #182 | Fair 74.9% |
| Immigrants | Costa Rica | 36.7 /100 | #183 | Fair 74.9% |
| Immigrants | Hungary | 35.0 /100 | #184 | Fair 74.9% |
| Sri Lankans | 34.9 /100 | #185 | Fair 74.9% |
| Immigrants | Eastern Europe | 33.8 /100 | #186 | Fair 74.9% |
Demographics Similar to Nonimmigrants by In Labor Force | Age 20-24
In terms of in labor force | age 20-24, the demographic groups most similar to Nonimmigrants are Potawatomi (76.2%, a difference of 0.010%), Immigrants from Germany (76.2%, a difference of 0.010%), Immigrants from Lithuania (76.1%, a difference of 0.10%), Immigrants from Oceania (76.1%, a difference of 0.10%), and Hungarian (76.3%, a difference of 0.11%).
| Demographics | Rating | Rank | In Labor Force | Age 20-24 |
| Bulgarians | 99.2 /100 | #89 | Exceptional 76.4% |
| Immigrants | Burma/Myanmar | 99.1 /100 | #90 | Exceptional 76.3% |
| Sierra Leoneans | 99.0 /100 | #91 | Exceptional 76.3% |
| Maltese | 98.9 /100 | #92 | Exceptional 76.3% |
| Hungarians | 98.9 /100 | #93 | Exceptional 76.3% |
| Potawatomi | 98.5 /100 | #94 | Exceptional 76.2% |
| Immigrants | Germany | 98.5 /100 | #95 | Exceptional 76.2% |
| Immigrants | Nonimmigrants | 98.5 /100 | #96 | Exceptional 76.2% |
| Immigrants | Lithuania | 98.0 /100 | #97 | Exceptional 76.1% |
| Immigrants | Oceania | 98.0 /100 | #98 | Exceptional 76.1% |
| Americans | 97.8 /100 | #99 | Exceptional 76.1% |
| Shoshone | 97.8 /100 | #100 | Exceptional 76.1% |
| Immigrants | Poland | 97.7 /100 | #101 | Exceptional 76.1% |
| Latvians | 97.6 /100 | #102 | Exceptional 76.1% |
| Immigrants | North Macedonia | 97.5 /100 | #103 | Exceptional 76.1% |