Immigrants from Latvia vs Nonimmigrants Median Family Income
COMPARE
Immigrants from Latvia
Nonimmigrants
Median Family Income
Median Family Income Comparison
Immigrants from Latvia
Nonimmigrants
$114,826
MEDIAN FAMILY INCOME
99.8/ 100
METRIC RATING
60th/ 347
METRIC RANK
$96,231
MEDIAN FAMILY INCOME
3.6/ 100
METRIC RATING
224th/ 347
METRIC RANK
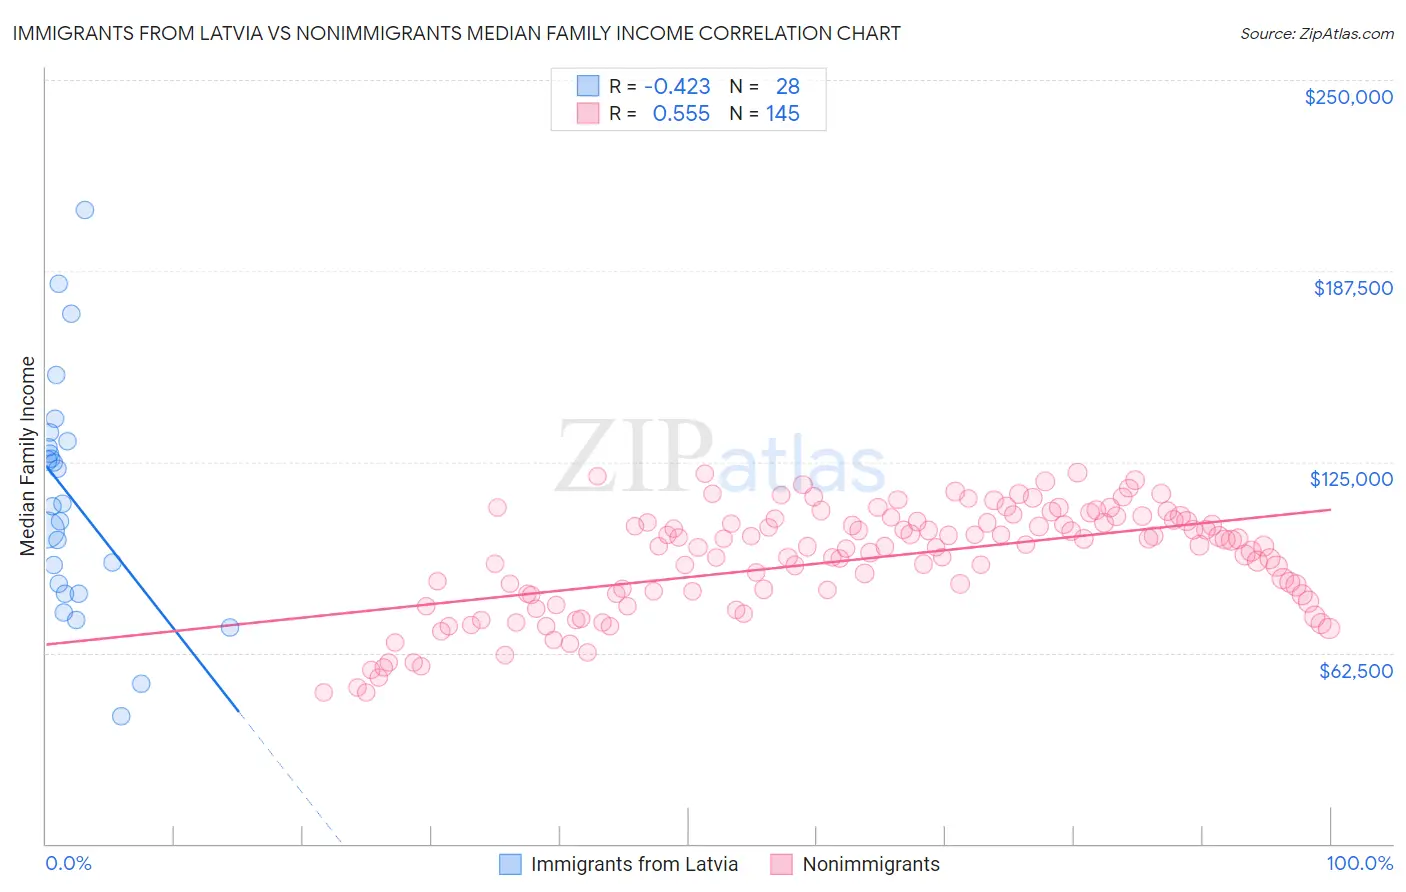
Immigrants from Latvia vs Nonimmigrants Median Family Income Correlation Chart
The statistical analysis conducted on geographies consisting of 113,722,830 people shows a moderate negative correlation between the proportion of Immigrants from Latvia and median family income in the United States with a correlation coefficient (R) of -0.423 and weighted average of $114,826. Similarly, the statistical analysis conducted on geographies consisting of 582,429,666 people shows a substantial positive correlation between the proportion of Nonimmigrants and median family income in the United States with a correlation coefficient (R) of 0.555 and weighted average of $96,231, a difference of 19.3%.
Median Family Income Correlation Summary
| Measurement | Immigrants from Latvia | Nonimmigrants |
| Minimum | $41,641 | $49,547 |
| Maximum | $207,328 | $121,513 |
| Range | $165,687 | $71,966 |
| Mean | $112,663 | $93,127 |
| Median | $110,782 | $97,277 |
| Interquartile 25% (IQ1) | $83,546 | $81,657 |
| Interquartile 75% (IQ3) | $130,754 | $105,547 |
| Interquartile Range (IQR) | $47,207 | $23,890 |
| Standard Deviation (Sample) | $38,081 | $17,276 |
| Standard Deviation (Population) | $37,395 | $17,216 |
Similar Demographics by Median Family Income
Demographics Similar to Immigrants from Latvia by Median Family Income
In terms of median family income, the demographic groups most similar to Immigrants from Latvia are Immigrants from Netherlands ($114,987, a difference of 0.14%), Immigrants from Belarus ($114,586, a difference of 0.21%), Mongolian ($114,553, a difference of 0.24%), Immigrants from Indonesia ($115,162, a difference of 0.29%), and Greek ($115,192, a difference of 0.32%).
| Demographics | Rating | Rank | Median Family Income |
| Immigrants | Norway | 99.9 /100 | #53 | Exceptional $115,847 |
| Immigrants | Europe | 99.9 /100 | #54 | Exceptional $115,523 |
| Lithuanians | 99.8 /100 | #55 | Exceptional $115,395 |
| New Zealanders | 99.8 /100 | #56 | Exceptional $115,230 |
| Greeks | 99.8 /100 | #57 | Exceptional $115,192 |
| Immigrants | Indonesia | 99.8 /100 | #58 | Exceptional $115,162 |
| Immigrants | Netherlands | 99.8 /100 | #59 | Exceptional $114,987 |
| Immigrants | Latvia | 99.8 /100 | #60 | Exceptional $114,826 |
| Immigrants | Belarus | 99.8 /100 | #61 | Exceptional $114,586 |
| Mongolians | 99.8 /100 | #62 | Exceptional $114,553 |
| Immigrants | Pakistan | 99.8 /100 | #63 | Exceptional $114,406 |
| Immigrants | Scotland | 99.7 /100 | #64 | Exceptional $114,392 |
| Egyptians | 99.7 /100 | #65 | Exceptional $114,119 |
| Paraguayans | 99.7 /100 | #66 | Exceptional $114,016 |
| Immigrants | Spain | 99.7 /100 | #67 | Exceptional $113,815 |
Demographics Similar to Nonimmigrants by Median Family Income
In terms of median family income, the demographic groups most similar to Nonimmigrants are Venezuelan ($96,281, a difference of 0.050%), Vietnamese ($96,123, a difference of 0.11%), Immigrants from Nigeria ($96,439, a difference of 0.22%), Immigrants from Ghana ($96,544, a difference of 0.33%), and Sudanese ($96,783, a difference of 0.57%).
| Demographics | Rating | Rank | Median Family Income |
| Japanese | 6.0 /100 | #217 | Tragic $97,288 |
| Immigrants | Cambodia | 5.8 /100 | #218 | Tragic $97,222 |
| Delaware | 5.1 /100 | #219 | Tragic $96,958 |
| Sudanese | 4.7 /100 | #220 | Tragic $96,783 |
| Immigrants | Ghana | 4.2 /100 | #221 | Tragic $96,544 |
| Immigrants | Nigeria | 4.0 /100 | #222 | Tragic $96,439 |
| Venezuelans | 3.7 /100 | #223 | Tragic $96,281 |
| Immigrants | Nonimmigrants | 3.6 /100 | #224 | Tragic $96,231 |
| Vietnamese | 3.4 /100 | #225 | Tragic $96,123 |
| Immigrants | Panama | 2.7 /100 | #226 | Tragic $95,647 |
| Alaska Natives | 2.6 /100 | #227 | Tragic $95,573 |
| Immigrants | Azores | 2.4 /100 | #228 | Tragic $95,402 |
| Marshallese | 2.2 /100 | #229 | Tragic $95,293 |
| Malaysians | 2.2 /100 | #230 | Tragic $95,230 |
| Ecuadorians | 2.1 /100 | #231 | Tragic $95,114 |