Armenian vs Irish Married-Couple Family Poverty
COMPARE
Armenian
Irish
Married-Couple Family Poverty
Married-Couple Family Poverty Comparison
Armenians
Irish
5.5%
MARRIED-COUPLE FAMILY POVERTY
12.8/ 100
METRIC RATING
215th/ 347
METRIC RANK
4.2%
MARRIED-COUPLE FAMILY POVERTY
99.9/ 100
METRIC RATING
33rd/ 347
METRIC RANK
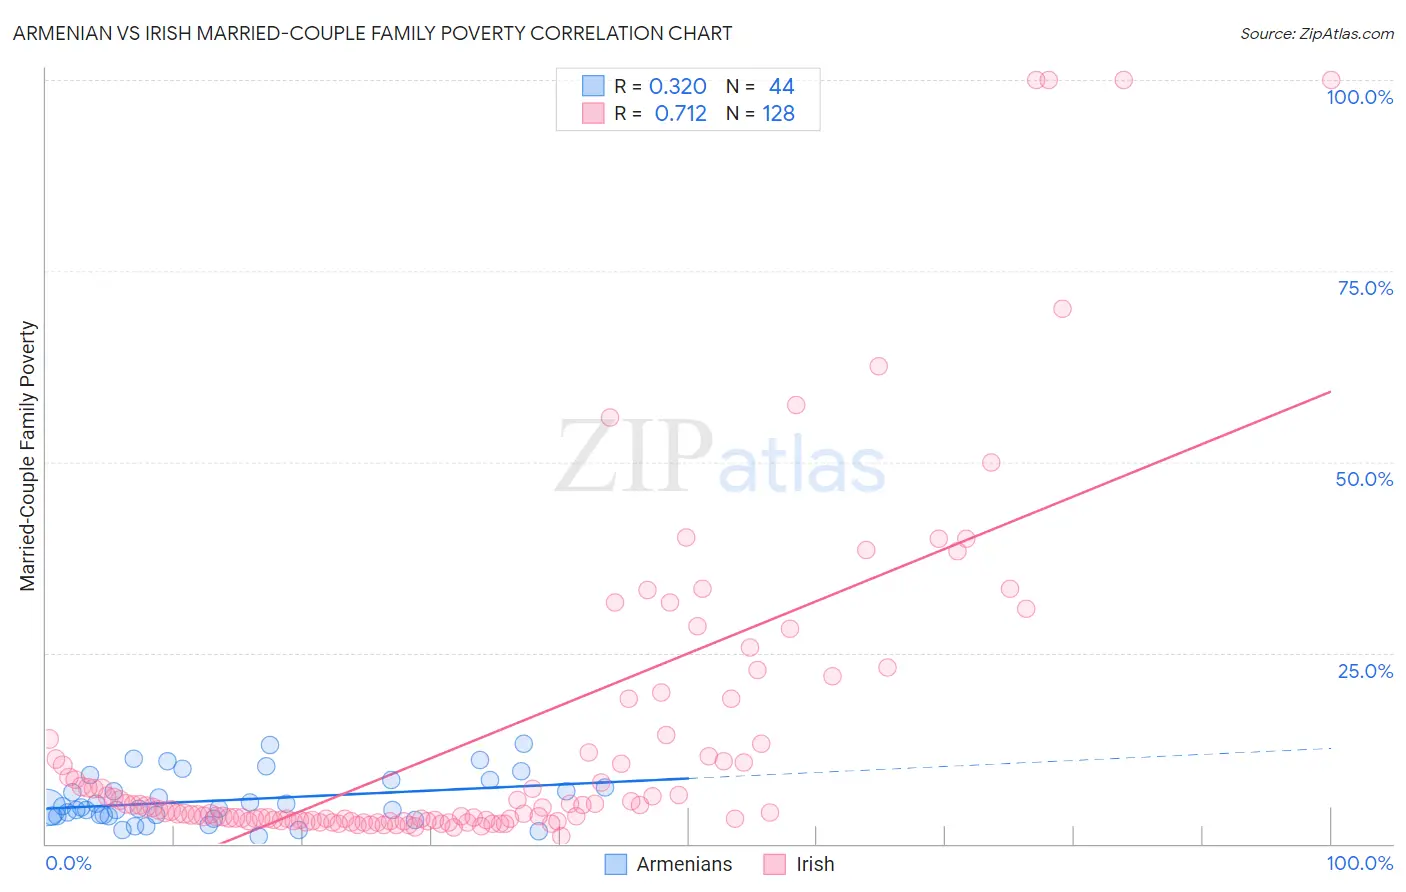
Armenian vs Irish Married-Couple Family Poverty Correlation Chart
The statistical analysis conducted on geographies consisting of 308,319,420 people shows a mild positive correlation between the proportion of Armenians and poverty level among married-couple families in the United States with a correlation coefficient (R) of 0.320 and weighted average of 5.5%. Similarly, the statistical analysis conducted on geographies consisting of 563,529,593 people shows a strong positive correlation between the proportion of Irish and poverty level among married-couple families in the United States with a correlation coefficient (R) of 0.712 and weighted average of 4.2%, a difference of 31.5%.
Married-Couple Family Poverty Correlation Summary
| Measurement | Armenian | Irish |
| Minimum | 0.96% | 0.92% |
| Maximum | 13.1% | 100.0% |
| Range | 12.1% | 99.1% |
| Mean | 5.7% | 13.8% |
| Median | 4.7% | 4.6% |
| Interquartile 25% (IQ1) | 3.6% | 3.1% |
| Interquartile 75% (IQ3) | 7.9% | 12.5% |
| Interquartile Range (IQR) | 4.2% | 9.4% |
| Standard Deviation (Sample) | 3.1% | 20.9% |
| Standard Deviation (Population) | 3.1% | 20.8% |
Similar Demographics by Married-Couple Family Poverty
Demographics Similar to Armenians by Married-Couple Family Poverty
In terms of married-couple family poverty, the demographic groups most similar to Armenians are Iroquois (5.5%, a difference of 0.060%), Immigrants from Liberia (5.5%, a difference of 0.11%), Potawatomi (5.5%, a difference of 0.12%), Immigrants from Thailand (5.5%, a difference of 0.29%), and Nigerian (5.5%, a difference of 0.35%).
| Demographics | Rating | Rank | Married-Couple Family Poverty |
| French American Indians | 16.1 /100 | #208 | Poor 5.5% |
| Immigrants | Syria | 15.4 /100 | #209 | Poor 5.5% |
| Immigrants | Micronesia | 14.4 /100 | #210 | Poor 5.5% |
| Nigerians | 14.3 /100 | #211 | Poor 5.5% |
| Immigrants | Thailand | 14.0 /100 | #212 | Poor 5.5% |
| Immigrants | Liberia | 13.3 /100 | #213 | Poor 5.5% |
| Iroquois | 13.1 /100 | #214 | Poor 5.5% |
| Armenians | 12.8 /100 | #215 | Poor 5.5% |
| Potawatomi | 12.4 /100 | #216 | Poor 5.5% |
| Immigrants | Nigeria | 11.3 /100 | #217 | Poor 5.5% |
| Afghans | 11.2 /100 | #218 | Poor 5.5% |
| Japanese | 9.8 /100 | #219 | Tragic 5.6% |
| Colombians | 9.2 /100 | #220 | Tragic 5.6% |
| Panamanians | 9.2 /100 | #221 | Tragic 5.6% |
| Cajuns | 6.9 /100 | #222 | Tragic 5.6% |
Demographics Similar to Irish by Married-Couple Family Poverty
In terms of married-couple family poverty, the demographic groups most similar to Irish are Dutch (4.2%, a difference of 0.23%), Greek (4.2%, a difference of 0.48%), Estonian (4.2%, a difference of 0.59%), Finnish (4.2%, a difference of 0.67%), and European (4.2%, a difference of 0.80%).
| Demographics | Rating | Rank | Married-Couple Family Poverty |
| Cypriots | 99.9 /100 | #26 | Exceptional 4.1% |
| Danes | 99.9 /100 | #27 | Exceptional 4.1% |
| Scandinavians | 99.9 /100 | #28 | Exceptional 4.1% |
| Immigrants | Scotland | 99.9 /100 | #29 | Exceptional 4.2% |
| Finns | 99.9 /100 | #30 | Exceptional 4.2% |
| Estonians | 99.9 /100 | #31 | Exceptional 4.2% |
| Greeks | 99.9 /100 | #32 | Exceptional 4.2% |
| Irish | 99.9 /100 | #33 | Exceptional 4.2% |
| Dutch | 99.9 /100 | #34 | Exceptional 4.2% |
| Europeans | 99.9 /100 | #35 | Exceptional 4.2% |
| English | 99.9 /100 | #36 | Exceptional 4.2% |
| Iranians | 99.9 /100 | #37 | Exceptional 4.2% |
| Belgians | 99.9 /100 | #38 | Exceptional 4.2% |
| Immigrants | Northern Europe | 99.8 /100 | #39 | Exceptional 4.2% |
| French Canadians | 99.8 /100 | #40 | Exceptional 4.2% |