Immigrants from Caribbean vs Thai Poverty
COMPARE
Immigrants from Caribbean
Thai
Poverty
Poverty Comparison
Immigrants from Caribbean
Thais
15.5%
POVERTY
0.0/ 100
METRIC RATING
303rd/ 347
METRIC RANK
9.6%
POVERTY
100.0/ 100
METRIC RATING
3rd/ 347
METRIC RANK
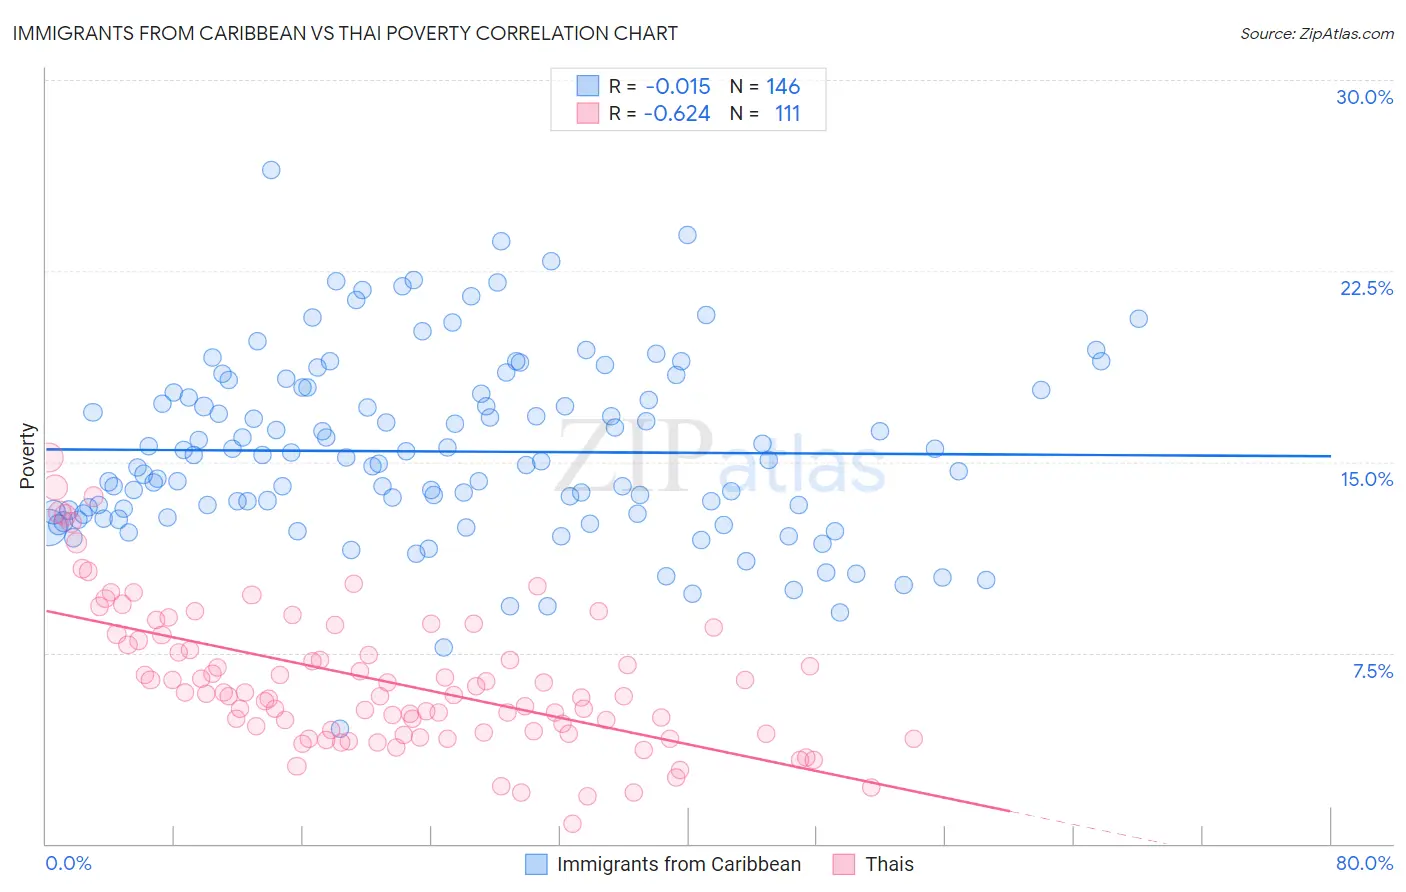
Immigrants from Caribbean vs Thai Poverty Correlation Chart
The statistical analysis conducted on geographies consisting of 449,609,031 people shows no correlation between the proportion of Immigrants from Caribbean and poverty level in the United States with a correlation coefficient (R) of -0.015 and weighted average of 15.5%. Similarly, the statistical analysis conducted on geographies consisting of 475,359,264 people shows a significant negative correlation between the proportion of Thais and poverty level in the United States with a correlation coefficient (R) of -0.624 and weighted average of 9.6%, a difference of 61.5%.
Poverty Correlation Summary
| Measurement | Immigrants from Caribbean | Thai |
| Minimum | 4.5% | 0.80% |
| Maximum | 26.5% | 15.1% |
| Range | 22.0% | 14.4% |
| Mean | 15.4% | 6.4% |
| Median | 15.0% | 5.9% |
| Interquartile 25% (IQ1) | 13.0% | 4.4% |
| Interquartile 75% (IQ3) | 17.7% | 8.2% |
| Interquartile Range (IQR) | 4.8% | 3.9% |
| Standard Deviation (Sample) | 3.6% | 2.8% |
| Standard Deviation (Population) | 3.6% | 2.8% |
Similar Demographics by Poverty
Demographics Similar to Immigrants from Caribbean by Poverty
In terms of poverty, the demographic groups most similar to Immigrants from Caribbean are Immigrants from Mexico (15.5%, a difference of 0.090%), Immigrants from Guatemala (15.5%, a difference of 0.12%), Somali (15.4%, a difference of 0.48%), Creek (15.6%, a difference of 0.56%), and Bahamian (15.4%, a difference of 0.61%).
| Demographics | Rating | Rank | Poverty |
| Hispanics or Latinos | 0.0 /100 | #296 | Tragic 15.3% |
| Immigrants | Bangladesh | 0.0 /100 | #297 | Tragic 15.3% |
| Immigrants | Senegal | 0.0 /100 | #298 | Tragic 15.3% |
| Senegalese | 0.0 /100 | #299 | Tragic 15.3% |
| Immigrants | Central America | 0.0 /100 | #300 | Tragic 15.4% |
| Bahamians | 0.0 /100 | #301 | Tragic 15.4% |
| Somalis | 0.0 /100 | #302 | Tragic 15.4% |
| Immigrants | Caribbean | 0.0 /100 | #303 | Tragic 15.5% |
| Immigrants | Mexico | 0.0 /100 | #304 | Tragic 15.5% |
| Immigrants | Guatemala | 0.0 /100 | #305 | Tragic 15.5% |
| Creek | 0.0 /100 | #306 | Tragic 15.6% |
| Africans | 0.0 /100 | #307 | Tragic 15.6% |
| Choctaw | 0.0 /100 | #308 | Tragic 15.6% |
| Seminole | 0.0 /100 | #309 | Tragic 15.6% |
| Dutch West Indians | 0.0 /100 | #310 | Tragic 15.6% |
Demographics Similar to Thais by Poverty
In terms of poverty, the demographic groups most similar to Thais are Chinese (9.5%, a difference of 0.45%), Immigrants from Taiwan (9.7%, a difference of 1.5%), Immigrants from Ireland (10.1%, a difference of 5.2%), Assyrian/Chaldean/Syriac (10.1%, a difference of 5.3%), and Filipino (10.1%, a difference of 5.5%).
| Demographics | Rating | Rank | Poverty |
| Immigrants | India | 100.0 /100 | #1 | Exceptional 9.0% |
| Chinese | 100.0 /100 | #2 | Exceptional 9.5% |
| Thais | 100.0 /100 | #3 | Exceptional 9.6% |
| Immigrants | Taiwan | 100.0 /100 | #4 | Exceptional 9.7% |
| Immigrants | Ireland | 99.9 /100 | #5 | Exceptional 10.1% |
| Assyrians/Chaldeans/Syriacs | 99.9 /100 | #6 | Exceptional 10.1% |
| Filipinos | 99.9 /100 | #7 | Exceptional 10.1% |
| Maltese | 99.9 /100 | #8 | Exceptional 10.2% |
| Immigrants | South Central Asia | 99.9 /100 | #9 | Exceptional 10.2% |
| Bulgarians | 99.9 /100 | #10 | Exceptional 10.2% |
| Immigrants | Lithuania | 99.9 /100 | #11 | Exceptional 10.3% |
| Bhutanese | 99.8 /100 | #12 | Exceptional 10.4% |
| Immigrants | Hong Kong | 99.8 /100 | #13 | Exceptional 10.4% |
| Immigrants | Bolivia | 99.8 /100 | #14 | Exceptional 10.4% |
| Bolivians | 99.8 /100 | #15 | Exceptional 10.4% |