Syrian vs Thai Poverty
COMPARE
Syrian
Thai
Poverty
Poverty Comparison
Syrians
Thais
12.0%
POVERTY
75.1/ 100
METRIC RATING
145th/ 347
METRIC RANK
9.6%
POVERTY
100.0/ 100
METRIC RATING
3rd/ 347
METRIC RANK
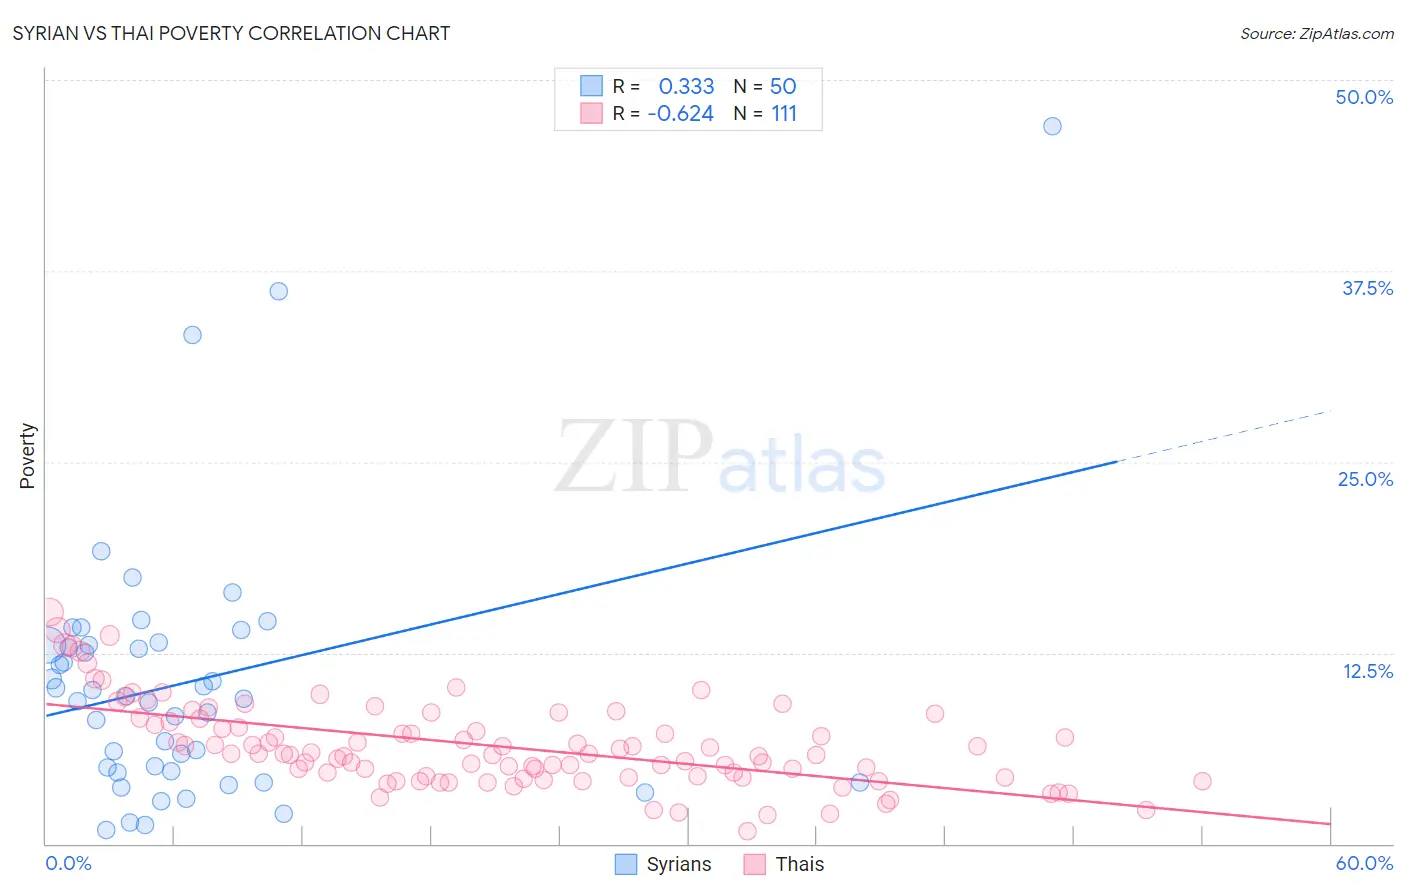
Syrian vs Thai Poverty Correlation Chart
The statistical analysis conducted on geographies consisting of 266,206,750 people shows a mild positive correlation between the proportion of Syrians and poverty level in the United States with a correlation coefficient (R) of 0.333 and weighted average of 12.0%. Similarly, the statistical analysis conducted on geographies consisting of 475,359,264 people shows a significant negative correlation between the proportion of Thais and poverty level in the United States with a correlation coefficient (R) of -0.624 and weighted average of 9.6%, a difference of 25.0%.
Poverty Correlation Summary
| Measurement | Syrian | Thai |
| Minimum | 0.89% | 0.80% |
| Maximum | 47.0% | 15.1% |
| Range | 46.1% | 14.4% |
| Mean | 10.6% | 6.4% |
| Median | 9.6% | 5.9% |
| Interquartile 25% (IQ1) | 4.8% | 4.4% |
| Interquartile 75% (IQ3) | 13.0% | 8.2% |
| Interquartile Range (IQR) | 8.3% | 3.9% |
| Standard Deviation (Sample) | 8.7% | 2.8% |
| Standard Deviation (Population) | 8.6% | 2.8% |
Similar Demographics by Poverty
Demographics Similar to Syrians by Poverty
In terms of poverty, the demographic groups most similar to Syrians are Afghan (12.0%, a difference of 0.030%), Immigrants from Bosnia and Herzegovina (12.0%, a difference of 0.19%), Immigrants from Germany (12.0%, a difference of 0.31%), Immigrants from Malaysia (12.0%, a difference of 0.32%), and Immigrants from Kazakhstan (12.0%, a difference of 0.37%).
| Demographics | Rating | Rank | Poverty |
| Immigrants | Jordan | 82.4 /100 | #138 | Excellent 11.9% |
| Pakistanis | 82.2 /100 | #139 | Excellent 11.9% |
| Immigrants | Peru | 81.1 /100 | #140 | Excellent 11.9% |
| Immigrants | France | 80.5 /100 | #141 | Excellent 11.9% |
| Basques | 80.4 /100 | #142 | Excellent 11.9% |
| Brazilians | 79.7 /100 | #143 | Good 11.9% |
| Icelanders | 77.9 /100 | #144 | Good 11.9% |
| Syrians | 75.1 /100 | #145 | Good 12.0% |
| Afghans | 74.9 /100 | #146 | Good 12.0% |
| Immigrants | Bosnia and Herzegovina | 73.7 /100 | #147 | Good 12.0% |
| Immigrants | Germany | 72.7 /100 | #148 | Good 12.0% |
| Immigrants | Malaysia | 72.7 /100 | #149 | Good 12.0% |
| Immigrants | Kazakhstan | 72.3 /100 | #150 | Good 12.0% |
| Samoans | 71.9 /100 | #151 | Good 12.0% |
| Armenians | 67.6 /100 | #152 | Good 12.1% |
Demographics Similar to Thais by Poverty
In terms of poverty, the demographic groups most similar to Thais are Chinese (9.5%, a difference of 0.45%), Immigrants from Taiwan (9.7%, a difference of 1.5%), Immigrants from Ireland (10.1%, a difference of 5.2%), Assyrian/Chaldean/Syriac (10.1%, a difference of 5.3%), and Filipino (10.1%, a difference of 5.5%).
| Demographics | Rating | Rank | Poverty |
| Immigrants | India | 100.0 /100 | #1 | Exceptional 9.0% |
| Chinese | 100.0 /100 | #2 | Exceptional 9.5% |
| Thais | 100.0 /100 | #3 | Exceptional 9.6% |
| Immigrants | Taiwan | 100.0 /100 | #4 | Exceptional 9.7% |
| Immigrants | Ireland | 99.9 /100 | #5 | Exceptional 10.1% |
| Assyrians/Chaldeans/Syriacs | 99.9 /100 | #6 | Exceptional 10.1% |
| Filipinos | 99.9 /100 | #7 | Exceptional 10.1% |
| Maltese | 99.9 /100 | #8 | Exceptional 10.2% |
| Immigrants | South Central Asia | 99.9 /100 | #9 | Exceptional 10.2% |
| Bulgarians | 99.9 /100 | #10 | Exceptional 10.2% |
| Immigrants | Lithuania | 99.9 /100 | #11 | Exceptional 10.3% |
| Bhutanese | 99.8 /100 | #12 | Exceptional 10.4% |
| Immigrants | Hong Kong | 99.8 /100 | #13 | Exceptional 10.4% |
| Immigrants | Bolivia | 99.8 /100 | #14 | Exceptional 10.4% |
| Bolivians | 99.8 /100 | #15 | Exceptional 10.4% |