Immigrants from Caribbean vs Immigrants from Kenya Poverty
COMPARE
Immigrants from Caribbean
Immigrants from Kenya
Poverty
Poverty Comparison
Immigrants from Caribbean
Immigrants from Kenya
15.5%
POVERTY
0.0/ 100
METRIC RATING
303rd/ 347
METRIC RANK
12.8%
POVERTY
17.5/ 100
METRIC RATING
199th/ 347
METRIC RANK
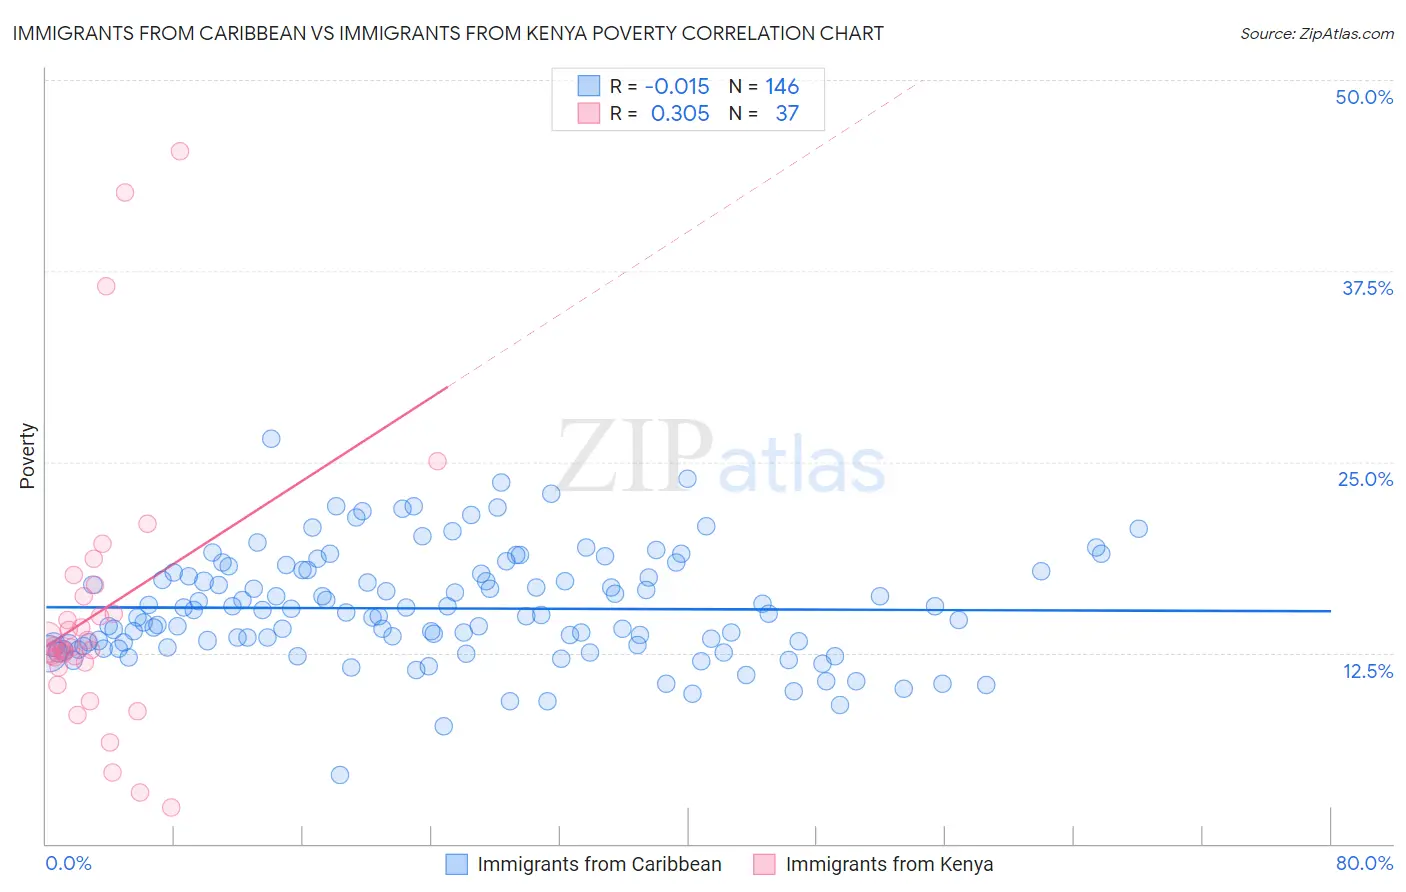
Immigrants from Caribbean vs Immigrants from Kenya Poverty Correlation Chart
The statistical analysis conducted on geographies consisting of 449,609,031 people shows no correlation between the proportion of Immigrants from Caribbean and poverty level in the United States with a correlation coefficient (R) of -0.015 and weighted average of 15.5%. Similarly, the statistical analysis conducted on geographies consisting of 217,998,097 people shows a mild positive correlation between the proportion of Immigrants from Kenya and poverty level in the United States with a correlation coefficient (R) of 0.305 and weighted average of 12.8%, a difference of 21.2%.
Poverty Correlation Summary
| Measurement | Immigrants from Caribbean | Immigrants from Kenya |
| Minimum | 4.5% | 2.4% |
| Maximum | 26.5% | 45.4% |
| Range | 22.0% | 43.0% |
| Mean | 15.4% | 15.2% |
| Median | 15.0% | 12.9% |
| Interquartile 25% (IQ1) | 13.0% | 11.7% |
| Interquartile 75% (IQ3) | 17.7% | 16.6% |
| Interquartile Range (IQR) | 4.8% | 4.8% |
| Standard Deviation (Sample) | 3.6% | 9.2% |
| Standard Deviation (Population) | 3.6% | 9.0% |
Similar Demographics by Poverty
Demographics Similar to Immigrants from Caribbean by Poverty
In terms of poverty, the demographic groups most similar to Immigrants from Caribbean are Immigrants from Mexico (15.5%, a difference of 0.090%), Immigrants from Guatemala (15.5%, a difference of 0.12%), Somali (15.4%, a difference of 0.48%), Creek (15.6%, a difference of 0.56%), and Bahamian (15.4%, a difference of 0.61%).
| Demographics | Rating | Rank | Poverty |
| Hispanics or Latinos | 0.0 /100 | #296 | Tragic 15.3% |
| Immigrants | Bangladesh | 0.0 /100 | #297 | Tragic 15.3% |
| Immigrants | Senegal | 0.0 /100 | #298 | Tragic 15.3% |
| Senegalese | 0.0 /100 | #299 | Tragic 15.3% |
| Immigrants | Central America | 0.0 /100 | #300 | Tragic 15.4% |
| Bahamians | 0.0 /100 | #301 | Tragic 15.4% |
| Somalis | 0.0 /100 | #302 | Tragic 15.4% |
| Immigrants | Caribbean | 0.0 /100 | #303 | Tragic 15.5% |
| Immigrants | Mexico | 0.0 /100 | #304 | Tragic 15.5% |
| Immigrants | Guatemala | 0.0 /100 | #305 | Tragic 15.5% |
| Creek | 0.0 /100 | #306 | Tragic 15.6% |
| Africans | 0.0 /100 | #307 | Tragic 15.6% |
| Choctaw | 0.0 /100 | #308 | Tragic 15.6% |
| Seminole | 0.0 /100 | #309 | Tragic 15.6% |
| Dutch West Indians | 0.0 /100 | #310 | Tragic 15.6% |
Demographics Similar to Immigrants from Kenya by Poverty
In terms of poverty, the demographic groups most similar to Immigrants from Kenya are Spaniard (12.8%, a difference of 0.16%), Immigrants from Uganda (12.8%, a difference of 0.16%), Spanish (12.8%, a difference of 0.19%), Immigrants from Lebanon (12.8%, a difference of 0.20%), and Immigrants from Uruguay (12.8%, a difference of 0.32%).
| Demographics | Rating | Rank | Poverty |
| South American Indians | 23.3 /100 | #192 | Fair 12.7% |
| Delaware | 21.4 /100 | #193 | Fair 12.7% |
| Arabs | 21.1 /100 | #194 | Fair 12.7% |
| Immigrants | Kuwait | 20.9 /100 | #195 | Fair 12.7% |
| Iraqis | 20.8 /100 | #196 | Fair 12.7% |
| Immigrants | Lebanon | 18.7 /100 | #197 | Poor 12.8% |
| Spanish | 18.7 /100 | #198 | Poor 12.8% |
| Immigrants | Kenya | 17.5 /100 | #199 | Poor 12.8% |
| Spaniards | 16.5 /100 | #200 | Poor 12.8% |
| Immigrants | Uganda | 16.5 /100 | #201 | Poor 12.8% |
| Immigrants | Uruguay | 15.6 /100 | #202 | Poor 12.8% |
| Hmong | 15.0 /100 | #203 | Poor 12.8% |
| Immigrants | Western Asia | 14.1 /100 | #204 | Poor 12.9% |
| Tsimshian | 9.2 /100 | #205 | Tragic 13.0% |
| Immigrants | Eastern Africa | 7.0 /100 | #206 | Tragic 13.1% |