Immigrants from El Salvador vs Thai Poverty
COMPARE
Immigrants from El Salvador
Thai
Poverty
Poverty Comparison
Immigrants from El Salvador
Thais
14.3%
POVERTY
0.1/ 100
METRIC RATING
254th/ 347
METRIC RANK
9.6%
POVERTY
100.0/ 100
METRIC RATING
3rd/ 347
METRIC RANK
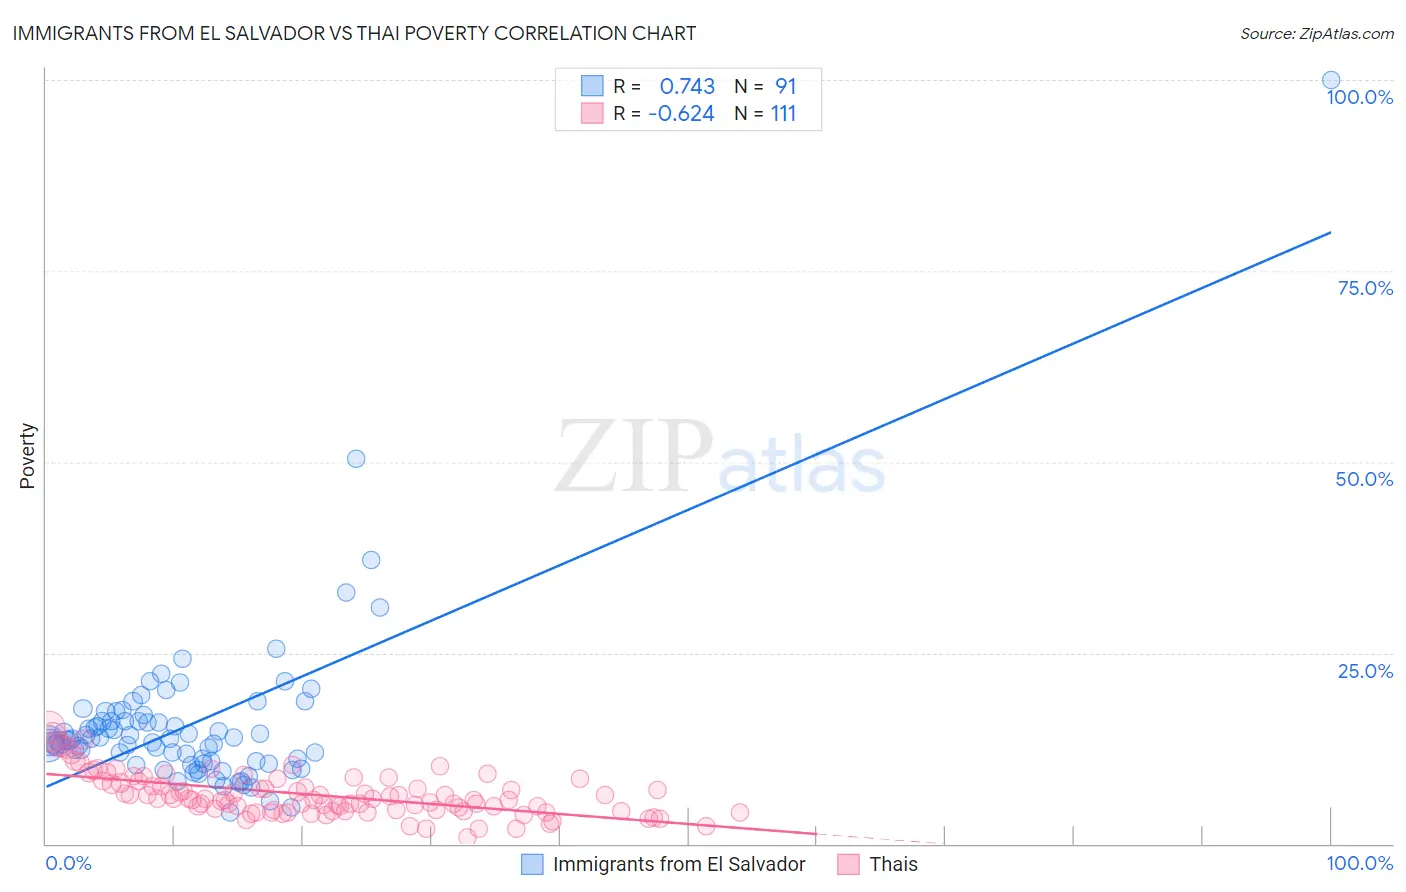
Immigrants from El Salvador vs Thai Poverty Correlation Chart
The statistical analysis conducted on geographies consisting of 357,703,291 people shows a strong positive correlation between the proportion of Immigrants from El Salvador and poverty level in the United States with a correlation coefficient (R) of 0.743 and weighted average of 14.3%. Similarly, the statistical analysis conducted on geographies consisting of 475,359,264 people shows a significant negative correlation between the proportion of Thais and poverty level in the United States with a correlation coefficient (R) of -0.624 and weighted average of 9.6%, a difference of 48.9%.
Poverty Correlation Summary
| Measurement | Immigrants from El Salvador | Thai |
| Minimum | 4.1% | 0.80% |
| Maximum | 100.0% | 15.1% |
| Range | 95.9% | 14.4% |
| Mean | 15.6% | 6.4% |
| Median | 13.5% | 5.9% |
| Interquartile 25% (IQ1) | 10.8% | 4.4% |
| Interquartile 75% (IQ3) | 16.1% | 8.2% |
| Interquartile Range (IQR) | 5.3% | 3.9% |
| Standard Deviation (Sample) | 11.2% | 2.8% |
| Standard Deviation (Population) | 11.1% | 2.8% |
Similar Demographics by Poverty
Demographics Similar to Immigrants from El Salvador by Poverty
In terms of poverty, the demographic groups most similar to Immigrants from El Salvador are Immigrants from Ecuador (14.3%, a difference of 0.10%), Mexican American Indian (14.3%, a difference of 0.11%), Trinidadian and Tobagonian (14.3%, a difference of 0.16%), Ottawa (14.3%, a difference of 0.17%), and Immigrants from Trinidad and Tobago (14.2%, a difference of 0.25%).
| Demographics | Rating | Rank | Poverty |
| Liberians | 0.2 /100 | #247 | Tragic 14.1% |
| Immigrants | Western Africa | 0.2 /100 | #248 | Tragic 14.1% |
| Immigrants | Ghana | 0.2 /100 | #249 | Tragic 14.2% |
| Cree | 0.2 /100 | #250 | Tragic 14.2% |
| Immigrants | Burma/Myanmar | 0.2 /100 | #251 | Tragic 14.2% |
| Spanish American Indians | 0.2 /100 | #252 | Tragic 14.2% |
| Immigrants | Trinidad and Tobago | 0.2 /100 | #253 | Tragic 14.2% |
| Immigrants | El Salvador | 0.1 /100 | #254 | Tragic 14.3% |
| Immigrants | Ecuador | 0.1 /100 | #255 | Tragic 14.3% |
| Mexican American Indians | 0.1 /100 | #256 | Tragic 14.3% |
| Trinidadians and Tobagonians | 0.1 /100 | #257 | Tragic 14.3% |
| Ottawa | 0.1 /100 | #258 | Tragic 14.3% |
| Immigrants | Nicaragua | 0.1 /100 | #259 | Tragic 14.3% |
| Cape Verdeans | 0.1 /100 | #260 | Tragic 14.4% |
| Cherokee | 0.1 /100 | #261 | Tragic 14.4% |
Demographics Similar to Thais by Poverty
In terms of poverty, the demographic groups most similar to Thais are Chinese (9.5%, a difference of 0.45%), Immigrants from Taiwan (9.7%, a difference of 1.5%), Immigrants from Ireland (10.1%, a difference of 5.2%), Assyrian/Chaldean/Syriac (10.1%, a difference of 5.3%), and Filipino (10.1%, a difference of 5.5%).
| Demographics | Rating | Rank | Poverty |
| Immigrants | India | 100.0 /100 | #1 | Exceptional 9.0% |
| Chinese | 100.0 /100 | #2 | Exceptional 9.5% |
| Thais | 100.0 /100 | #3 | Exceptional 9.6% |
| Immigrants | Taiwan | 100.0 /100 | #4 | Exceptional 9.7% |
| Immigrants | Ireland | 99.9 /100 | #5 | Exceptional 10.1% |
| Assyrians/Chaldeans/Syriacs | 99.9 /100 | #6 | Exceptional 10.1% |
| Filipinos | 99.9 /100 | #7 | Exceptional 10.1% |
| Maltese | 99.9 /100 | #8 | Exceptional 10.2% |
| Immigrants | South Central Asia | 99.9 /100 | #9 | Exceptional 10.2% |
| Bulgarians | 99.9 /100 | #10 | Exceptional 10.2% |
| Immigrants | Lithuania | 99.9 /100 | #11 | Exceptional 10.3% |
| Bhutanese | 99.8 /100 | #12 | Exceptional 10.4% |
| Immigrants | Hong Kong | 99.8 /100 | #13 | Exceptional 10.4% |
| Immigrants | Bolivia | 99.8 /100 | #14 | Exceptional 10.4% |
| Bolivians | 99.8 /100 | #15 | Exceptional 10.4% |