Immigrants from Caribbean vs Immigrants from Latin America Poverty
COMPARE
Immigrants from Caribbean
Immigrants from Latin America
Poverty
Poverty Comparison
Immigrants from Caribbean
Immigrants from Latin America
15.5%
POVERTY
0.0/ 100
METRIC RATING
303rd/ 347
METRIC RANK
15.0%
POVERTY
0.0/ 100
METRIC RATING
286th/ 347
METRIC RANK
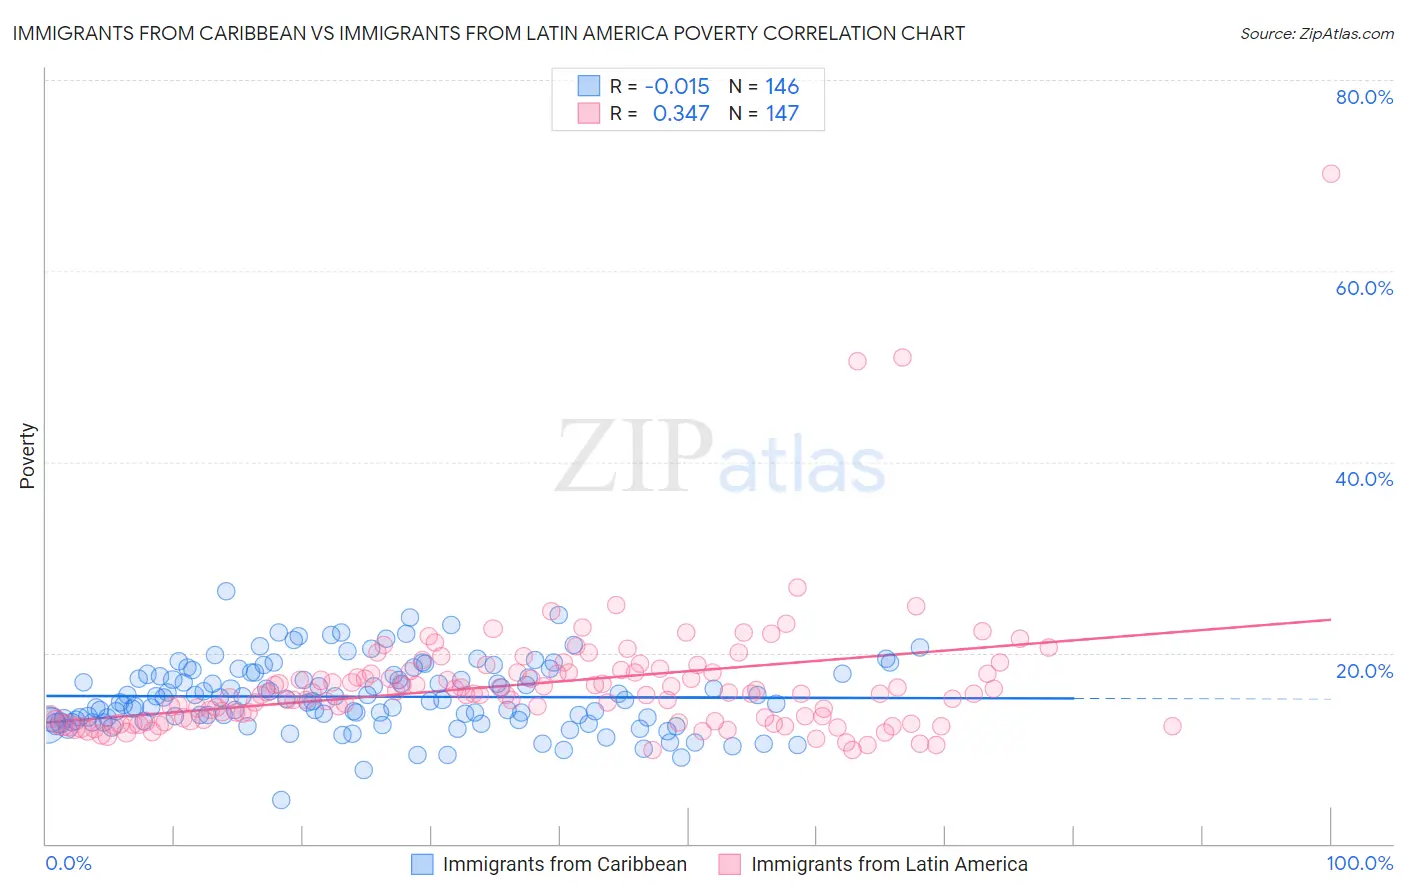
Immigrants from Caribbean vs Immigrants from Latin America Poverty Correlation Chart
The statistical analysis conducted on geographies consisting of 449,609,031 people shows no correlation between the proportion of Immigrants from Caribbean and poverty level in the United States with a correlation coefficient (R) of -0.015 and weighted average of 15.5%. Similarly, the statistical analysis conducted on geographies consisting of 557,920,338 people shows a mild positive correlation between the proportion of Immigrants from Latin America and poverty level in the United States with a correlation coefficient (R) of 0.347 and weighted average of 15.0%, a difference of 3.0%.
Poverty Correlation Summary
| Measurement | Immigrants from Caribbean | Immigrants from Latin America |
| Minimum | 4.5% | 9.8% |
| Maximum | 26.5% | 70.2% |
| Range | 22.0% | 60.4% |
| Mean | 15.4% | 16.7% |
| Median | 15.0% | 15.7% |
| Interquartile 25% (IQ1) | 13.0% | 12.9% |
| Interquartile 75% (IQ3) | 17.7% | 17.9% |
| Interquartile Range (IQR) | 4.8% | 5.0% |
| Standard Deviation (Sample) | 3.6% | 6.9% |
| Standard Deviation (Population) | 3.6% | 6.9% |
Demographics Similar to Immigrants from Caribbean and Immigrants from Latin America by Poverty
In terms of poverty, the demographic groups most similar to Immigrants from Caribbean are Immigrants from Mexico (15.5%, a difference of 0.090%), Somali (15.4%, a difference of 0.48%), Bahamian (15.4%, a difference of 0.61%), Immigrants from Central America (15.4%, a difference of 0.82%), and Senegalese (15.3%, a difference of 1.2%). Similarly, the demographic groups most similar to Immigrants from Latin America are Inupiat (15.1%, a difference of 0.21%), Yaqui (15.1%, a difference of 0.22%), Vietnamese (15.0%, a difference of 0.26%), West Indian (15.0%, a difference of 0.32%), and Immigrants from Belize (15.1%, a difference of 0.34%).
| Demographics | Rating | Rank | Poverty |
| West Indians | 0.0 /100 | #284 | Tragic 15.0% |
| Vietnamese | 0.0 /100 | #285 | Tragic 15.0% |
| Immigrants | Latin America | 0.0 /100 | #286 | Tragic 15.0% |
| Inupiat | 0.0 /100 | #287 | Tragic 15.1% |
| Yaqui | 0.0 /100 | #288 | Tragic 15.1% |
| Immigrants | Belize | 0.0 /100 | #289 | Tragic 15.1% |
| Mexicans | 0.0 /100 | #290 | Tragic 15.1% |
| Immigrants | Cabo Verde | 0.0 /100 | #291 | Tragic 15.1% |
| Indonesians | 0.0 /100 | #292 | Tragic 15.1% |
| Immigrants | Zaire | 0.0 /100 | #293 | Tragic 15.1% |
| Blackfeet | 0.0 /100 | #294 | Tragic 15.2% |
| Guatemalans | 0.0 /100 | #295 | Tragic 15.3% |
| Hispanics or Latinos | 0.0 /100 | #296 | Tragic 15.3% |
| Immigrants | Bangladesh | 0.0 /100 | #297 | Tragic 15.3% |
| Immigrants | Senegal | 0.0 /100 | #298 | Tragic 15.3% |
| Senegalese | 0.0 /100 | #299 | Tragic 15.3% |
| Immigrants | Central America | 0.0 /100 | #300 | Tragic 15.4% |
| Bahamians | 0.0 /100 | #301 | Tragic 15.4% |
| Somalis | 0.0 /100 | #302 | Tragic 15.4% |
| Immigrants | Caribbean | 0.0 /100 | #303 | Tragic 15.5% |
| Immigrants | Mexico | 0.0 /100 | #304 | Tragic 15.5% |