Immigrants from Caribbean vs Immigrants from Nigeria Poverty
COMPARE
Immigrants from Caribbean
Immigrants from Nigeria
Poverty
Poverty Comparison
Immigrants from Caribbean
Immigrants from Nigeria
15.5%
POVERTY
0.0/ 100
METRIC RATING
303rd/ 347
METRIC RANK
13.5%
POVERTY
1.7/ 100
METRIC RATING
228th/ 347
METRIC RANK
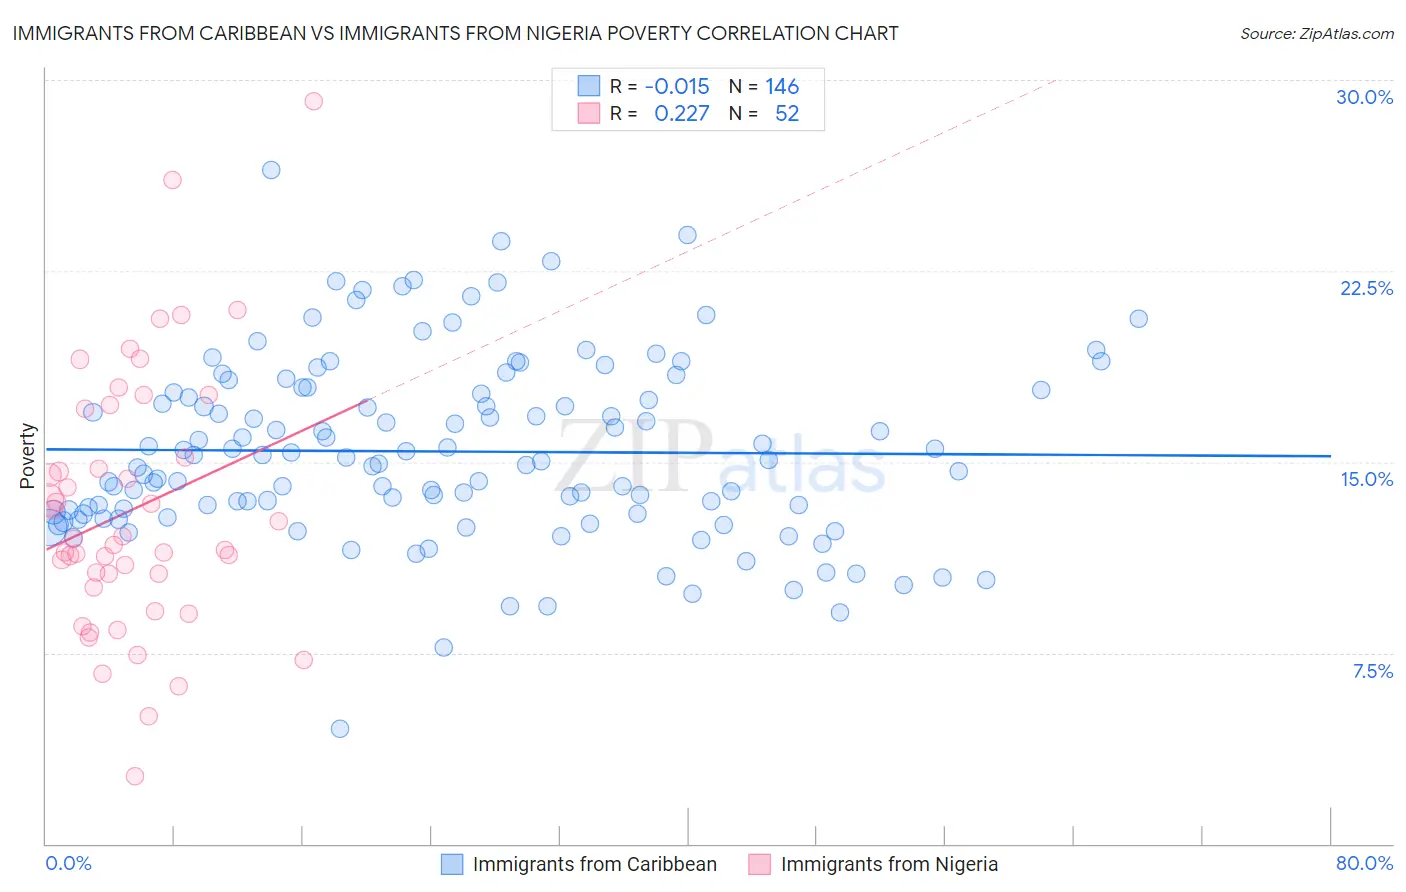
Immigrants from Caribbean vs Immigrants from Nigeria Poverty Correlation Chart
The statistical analysis conducted on geographies consisting of 449,609,031 people shows no correlation between the proportion of Immigrants from Caribbean and poverty level in the United States with a correlation coefficient (R) of -0.015 and weighted average of 15.5%. Similarly, the statistical analysis conducted on geographies consisting of 283,297,538 people shows a weak positive correlation between the proportion of Immigrants from Nigeria and poverty level in the United States with a correlation coefficient (R) of 0.227 and weighted average of 13.5%, a difference of 14.4%.
Poverty Correlation Summary
| Measurement | Immigrants from Caribbean | Immigrants from Nigeria |
| Minimum | 4.5% | 2.6% |
| Maximum | 26.5% | 29.2% |
| Range | 22.0% | 26.5% |
| Mean | 15.4% | 13.1% |
| Median | 15.0% | 11.9% |
| Interquartile 25% (IQ1) | 13.0% | 10.3% |
| Interquartile 75% (IQ3) | 17.7% | 16.1% |
| Interquartile Range (IQR) | 4.8% | 5.8% |
| Standard Deviation (Sample) | 3.6% | 5.1% |
| Standard Deviation (Population) | 3.6% | 5.1% |
Similar Demographics by Poverty
Demographics Similar to Immigrants from Caribbean by Poverty
In terms of poverty, the demographic groups most similar to Immigrants from Caribbean are Immigrants from Mexico (15.5%, a difference of 0.090%), Immigrants from Guatemala (15.5%, a difference of 0.12%), Somali (15.4%, a difference of 0.48%), Creek (15.6%, a difference of 0.56%), and Bahamian (15.4%, a difference of 0.61%).
| Demographics | Rating | Rank | Poverty |
| Hispanics or Latinos | 0.0 /100 | #296 | Tragic 15.3% |
| Immigrants | Bangladesh | 0.0 /100 | #297 | Tragic 15.3% |
| Immigrants | Senegal | 0.0 /100 | #298 | Tragic 15.3% |
| Senegalese | 0.0 /100 | #299 | Tragic 15.3% |
| Immigrants | Central America | 0.0 /100 | #300 | Tragic 15.4% |
| Bahamians | 0.0 /100 | #301 | Tragic 15.4% |
| Somalis | 0.0 /100 | #302 | Tragic 15.4% |
| Immigrants | Caribbean | 0.0 /100 | #303 | Tragic 15.5% |
| Immigrants | Mexico | 0.0 /100 | #304 | Tragic 15.5% |
| Immigrants | Guatemala | 0.0 /100 | #305 | Tragic 15.5% |
| Creek | 0.0 /100 | #306 | Tragic 15.6% |
| Africans | 0.0 /100 | #307 | Tragic 15.6% |
| Choctaw | 0.0 /100 | #308 | Tragic 15.6% |
| Seminole | 0.0 /100 | #309 | Tragic 15.6% |
| Dutch West Indians | 0.0 /100 | #310 | Tragic 15.6% |
Demographics Similar to Immigrants from Nigeria by Poverty
In terms of poverty, the demographic groups most similar to Immigrants from Nigeria are Osage (13.6%, a difference of 0.24%), Alaskan Athabascan (13.6%, a difference of 0.30%), Alaska Native (13.5%, a difference of 0.45%), Nigerian (13.6%, a difference of 0.46%), and Marshallese (13.4%, a difference of 0.60%).
| Demographics | Rating | Rank | Poverty |
| Alsatians | 2.6 /100 | #221 | Tragic 13.4% |
| Immigrants | Micronesia | 2.6 /100 | #222 | Tragic 13.4% |
| Immigrants | Africa | 2.5 /100 | #223 | Tragic 13.4% |
| Immigrants | Eritrea | 2.4 /100 | #224 | Tragic 13.4% |
| German Russians | 2.2 /100 | #225 | Tragic 13.4% |
| Marshallese | 2.2 /100 | #226 | Tragic 13.4% |
| Alaska Natives | 2.1 /100 | #227 | Tragic 13.5% |
| Immigrants | Nigeria | 1.7 /100 | #228 | Tragic 13.5% |
| Osage | 1.5 /100 | #229 | Tragic 13.6% |
| Alaskan Athabascans | 1.5 /100 | #230 | Tragic 13.6% |
| Nigerians | 1.4 /100 | #231 | Tragic 13.6% |
| Fijians | 0.8 /100 | #232 | Tragic 13.7% |
| Immigrants | Saudi Arabia | 0.8 /100 | #233 | Tragic 13.8% |
| Immigrants | Laos | 0.7 /100 | #234 | Tragic 13.8% |
| Cubans | 0.6 /100 | #235 | Tragic 13.9% |