Immigrants from Caribbean vs Immigrants from England Poverty
COMPARE
Immigrants from Caribbean
Immigrants from England
Poverty
Poverty Comparison
Immigrants from Caribbean
Immigrants from England
15.5%
POVERTY
0.0/ 100
METRIC RATING
303rd/ 347
METRIC RANK
11.4%
POVERTY
96.2/ 100
METRIC RATING
85th/ 347
METRIC RANK
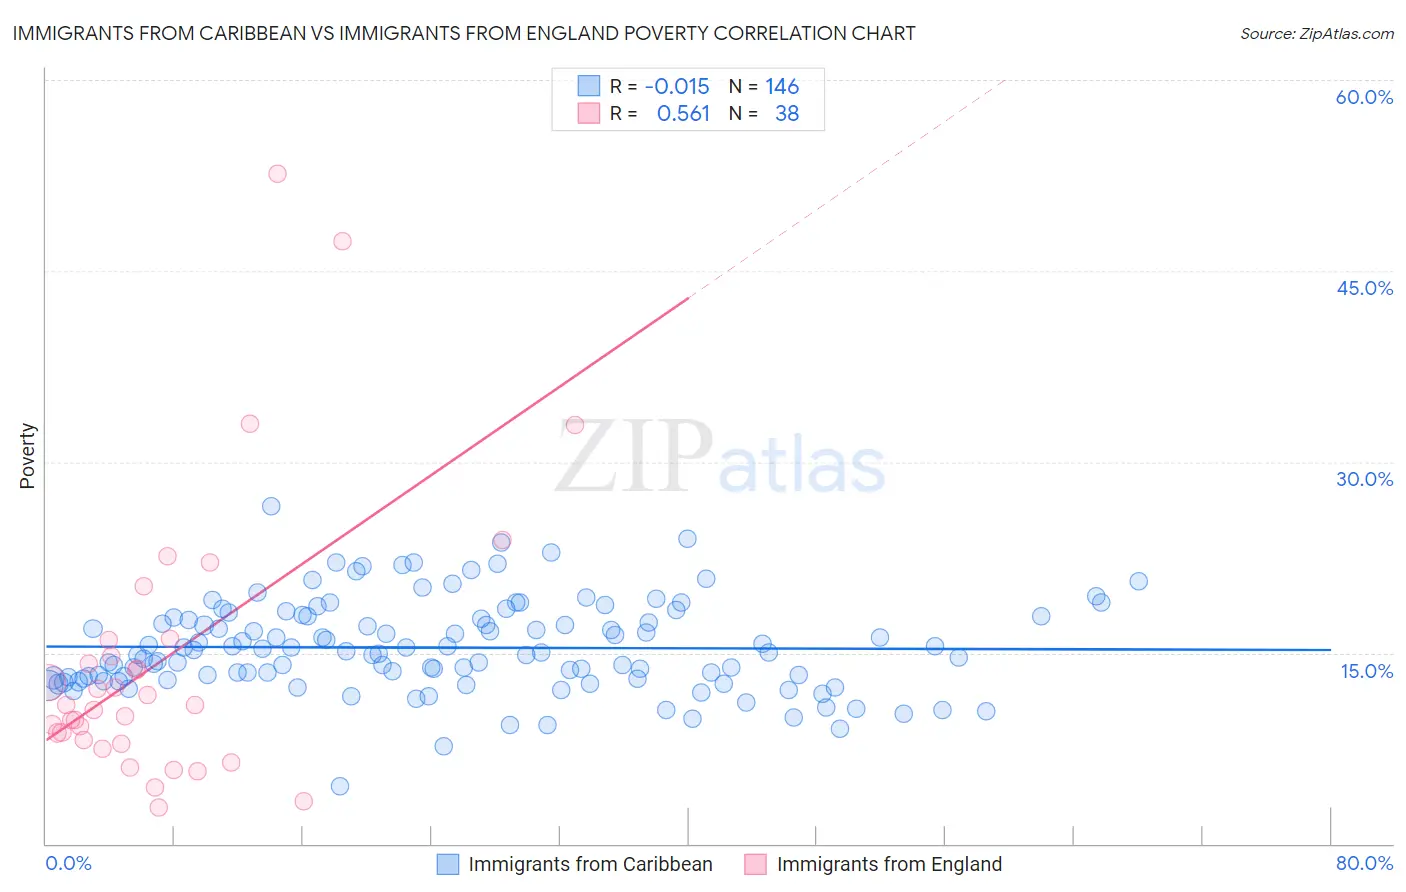
Immigrants from Caribbean vs Immigrants from England Poverty Correlation Chart
The statistical analysis conducted on geographies consisting of 449,609,031 people shows no correlation between the proportion of Immigrants from Caribbean and poverty level in the United States with a correlation coefficient (R) of -0.015 and weighted average of 15.5%. Similarly, the statistical analysis conducted on geographies consisting of 391,749,071 people shows a substantial positive correlation between the proportion of Immigrants from England and poverty level in the United States with a correlation coefficient (R) of 0.561 and weighted average of 11.4%, a difference of 36.4%.
Poverty Correlation Summary
| Measurement | Immigrants from Caribbean | Immigrants from England |
| Minimum | 4.5% | 2.8% |
| Maximum | 26.5% | 52.7% |
| Range | 22.0% | 49.8% |
| Mean | 15.4% | 14.4% |
| Median | 15.0% | 10.9% |
| Interquartile 25% (IQ1) | 13.0% | 8.2% |
| Interquartile 75% (IQ3) | 17.7% | 16.0% |
| Interquartile Range (IQR) | 4.8% | 7.8% |
| Standard Deviation (Sample) | 3.6% | 11.0% |
| Standard Deviation (Population) | 3.6% | 10.9% |
Similar Demographics by Poverty
Demographics Similar to Immigrants from Caribbean by Poverty
In terms of poverty, the demographic groups most similar to Immigrants from Caribbean are Immigrants from Mexico (15.5%, a difference of 0.090%), Immigrants from Guatemala (15.5%, a difference of 0.12%), Somali (15.4%, a difference of 0.48%), Creek (15.6%, a difference of 0.56%), and Bahamian (15.4%, a difference of 0.61%).
| Demographics | Rating | Rank | Poverty |
| Hispanics or Latinos | 0.0 /100 | #296 | Tragic 15.3% |
| Immigrants | Bangladesh | 0.0 /100 | #297 | Tragic 15.3% |
| Immigrants | Senegal | 0.0 /100 | #298 | Tragic 15.3% |
| Senegalese | 0.0 /100 | #299 | Tragic 15.3% |
| Immigrants | Central America | 0.0 /100 | #300 | Tragic 15.4% |
| Bahamians | 0.0 /100 | #301 | Tragic 15.4% |
| Somalis | 0.0 /100 | #302 | Tragic 15.4% |
| Immigrants | Caribbean | 0.0 /100 | #303 | Tragic 15.5% |
| Immigrants | Mexico | 0.0 /100 | #304 | Tragic 15.5% |
| Immigrants | Guatemala | 0.0 /100 | #305 | Tragic 15.5% |
| Creek | 0.0 /100 | #306 | Tragic 15.6% |
| Africans | 0.0 /100 | #307 | Tragic 15.6% |
| Choctaw | 0.0 /100 | #308 | Tragic 15.6% |
| Seminole | 0.0 /100 | #309 | Tragic 15.6% |
| Dutch West Indians | 0.0 /100 | #310 | Tragic 15.6% |
Demographics Similar to Immigrants from England by Poverty
In terms of poverty, the demographic groups most similar to Immigrants from England are English (11.3%, a difference of 0.070%), Immigrants from Sweden (11.3%, a difference of 0.080%), Jordanian (11.4%, a difference of 0.12%), Northern European (11.4%, a difference of 0.12%), and Egyptian (11.3%, a difference of 0.25%).
| Demographics | Rating | Rank | Poverty |
| Dutch | 96.7 /100 | #78 | Exceptional 11.3% |
| Cambodians | 96.7 /100 | #79 | Exceptional 11.3% |
| Indians (Asian) | 96.6 /100 | #80 | Exceptional 11.3% |
| Irish | 96.6 /100 | #81 | Exceptional 11.3% |
| Egyptians | 96.5 /100 | #82 | Exceptional 11.3% |
| Immigrants | Sweden | 96.3 /100 | #83 | Exceptional 11.3% |
| English | 96.3 /100 | #84 | Exceptional 11.3% |
| Immigrants | England | 96.2 /100 | #85 | Exceptional 11.4% |
| Jordanians | 96.0 /100 | #86 | Exceptional 11.4% |
| Northern Europeans | 96.0 /100 | #87 | Exceptional 11.4% |
| Belgians | 95.8 /100 | #88 | Exceptional 11.4% |
| Czechoslovakians | 95.7 /100 | #89 | Exceptional 11.4% |
| Immigrants | Denmark | 95.5 /100 | #90 | Exceptional 11.4% |
| Finns | 95.2 /100 | #91 | Exceptional 11.4% |
| British | 95.0 /100 | #92 | Exceptional 11.4% |